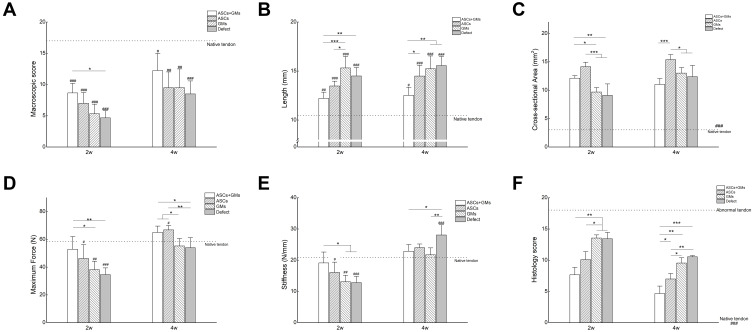
Figure 7.
Results of the macroscopic scoring of repaired tissue (A), the length of repaired tissue (B), the cross-sectional area of repaired tissue (C), the maximum force of repaired tissue (D), the stiffness of repaired tissue (E), and the histology score of repaired tissue (F). Data are presented as the mean ± SD; *P<0.05; **P< 0.01; ***P< 0.001; #P<0.05 vs the normal tendon; ##P<0.01 vs the normal tendon; ###P<0.001 vs the normal tendon.

