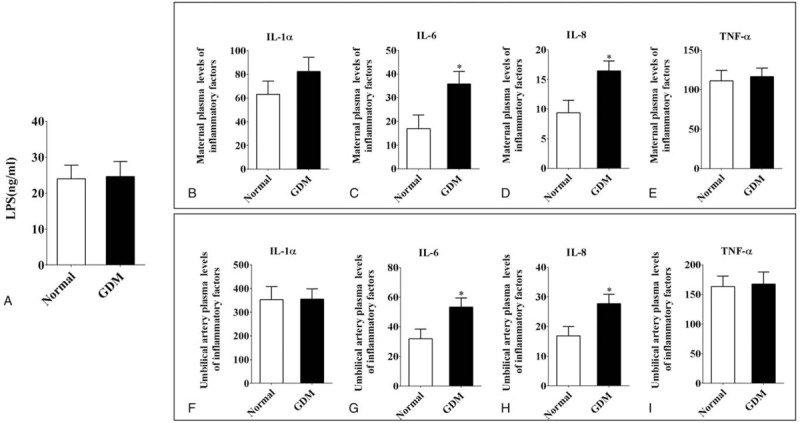
Figure 2.

The comparison of the inflammatory factors in maternal and umbilical artery blood plasma. A: Mean plasma LPS values (ng/ml) from normal and GDM women. B-E: The ELISA data showing the expression of the inflammatory factors: IL-1α (B), IL-6 (C), IL-8 (D) and TNF-α (E) in maternal blood plasma. F-I: The ELISA data showing the expression of the inflammatory factors: IL-1α (F), IL-6 (G), IL-8 (H) and TNF-α (I) in umbilical artery blood plasma. ∗ P < .05.
