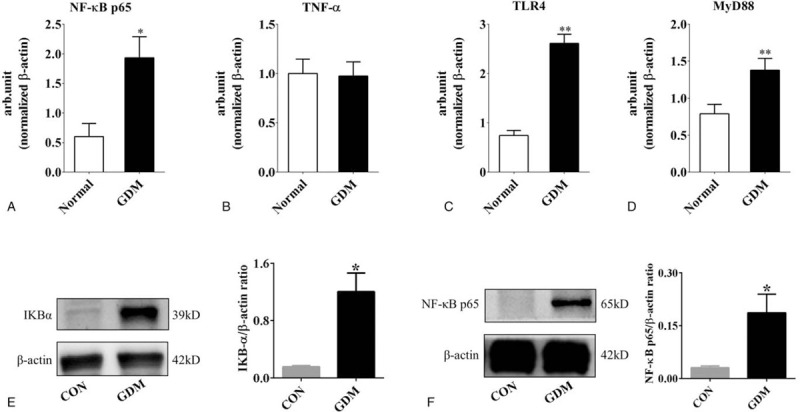
Figure 4.

Analysis of inflammatory factors in normal and GDM placentas. A-D: The quantitative PCR data show the gene expression levels of NF-κB p65 (A), TNF-α (B), TLR4 (C) and MyD88 (D) in normal and GDM placentas. E-F: Western blotting data show the gene expression levels of IKBα (E) and NF-κB p65 (F). ∗ P < .05, ∗∗ P < .01.
