Figure 5.

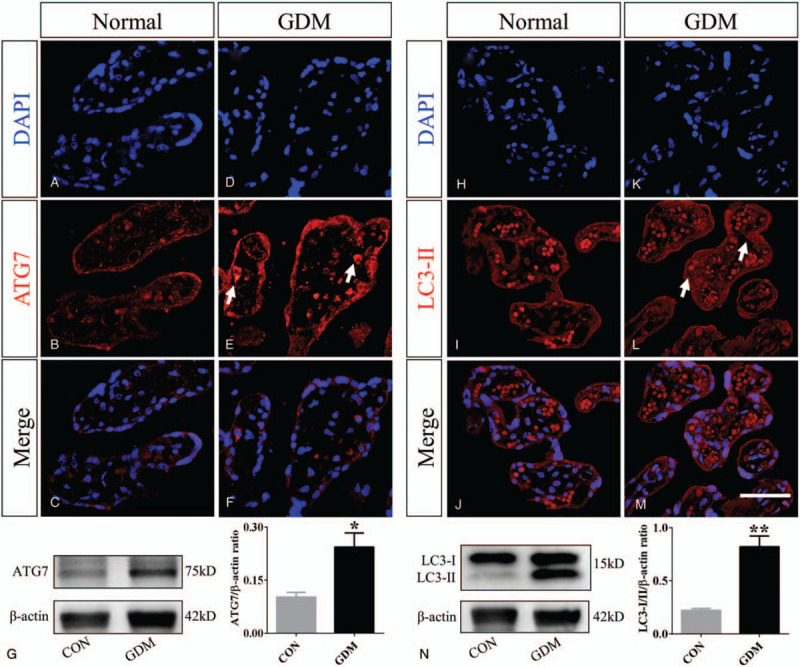
Comparisons of autophagy-related genes in placental villi of normal and GDM groups. A-F: Representative transverse sections of DAPI staining (A and D), ATG7 staining (B and E), and merged images (C and F) that were taken in normal and GDM placentas. G: Western blotting data show the protein expression level of ATG7. H-M: The representative transverse sections of DAPI staining (H and K), LC3II staining (I and L), and merged images (J and M) that were taken in normal and GDM placentas. The white arrows in E and L indicate highly expressing ATG7 and LC3II cells. N: Western blotting data show the protein expression levels of LC3I/II. ∗ P < .05, ∗∗ P < .01. Scale bar = 50 μm in A-F and H-M.
