
Figure 3.
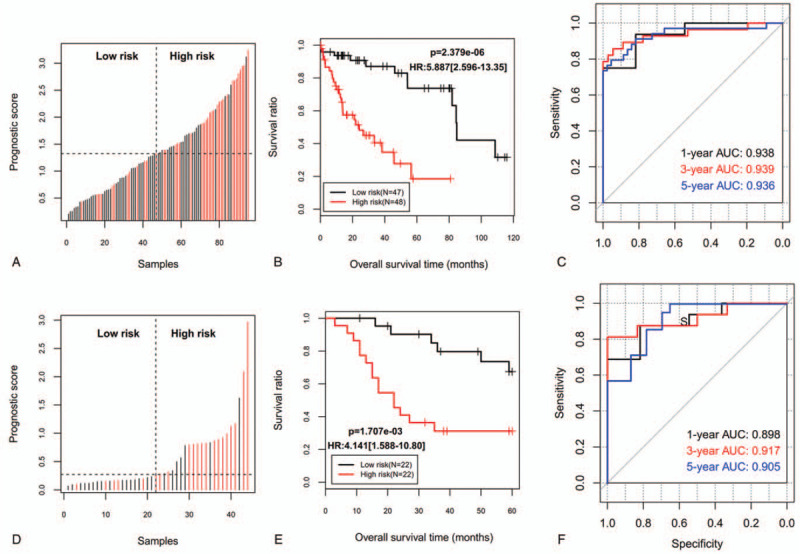
The prognosis of patients in high-risk and low-risk groups divided according to the risk score. A, D: Distribution of risk score of training set (A) and validation set (D); B, E: Kaplan–Meier survival analysis between patients at a low and high risk of death for the training set (B) and validation set (E); C, F: time dependent ROC curves at 1-, 3-, and 5-years for the training set (C) and validation set (F). AUC = the area under the ROC curve; HR = hazard ratio; ROC = receiver operating characteristic curve.