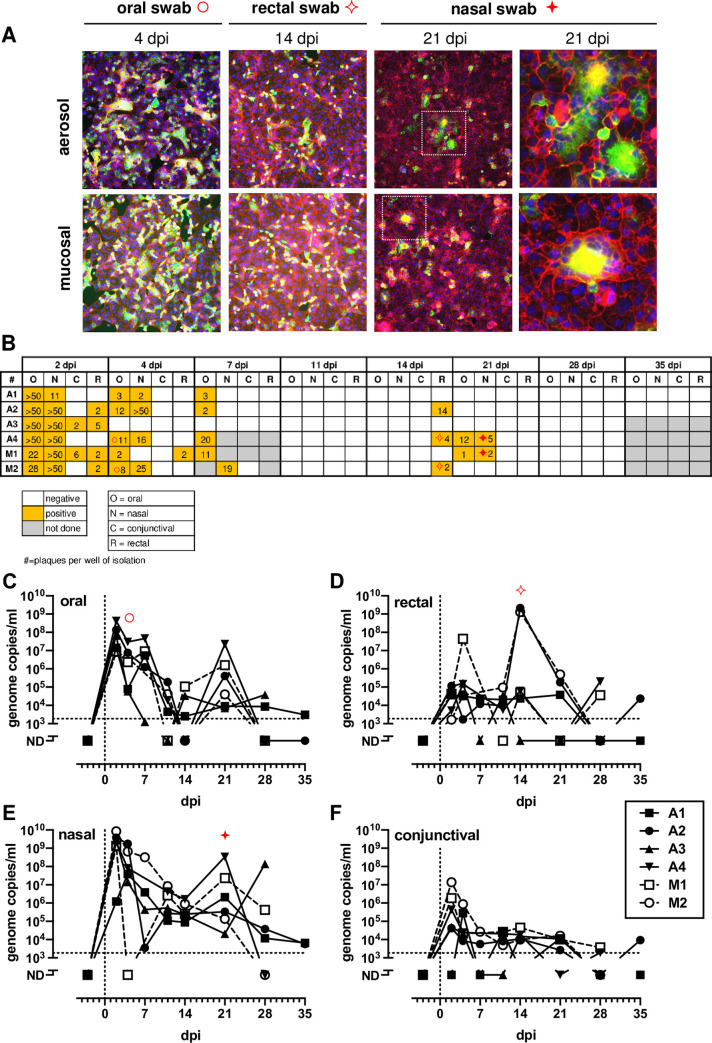
Fig 1. Detection and isolation of SARS-CoV-2 in swabs.
(A) Representative virus isolations confirmed by immunofluorescence using anti-SARS2 spike Ab with phalloidin as background. (B) Isolation results from swabs. Number in each square represents the # of plaques obtained from isolation. (C-F) vRNA in swabs measured by q-RT-PCR. AGM infected by aerosol (closed symbols/solid lines; n = 4) or multi-route mucosal (open symbols/dashed lines; n = 2). In B-F, Red symbols highlight representative IFA images shown in (A).

