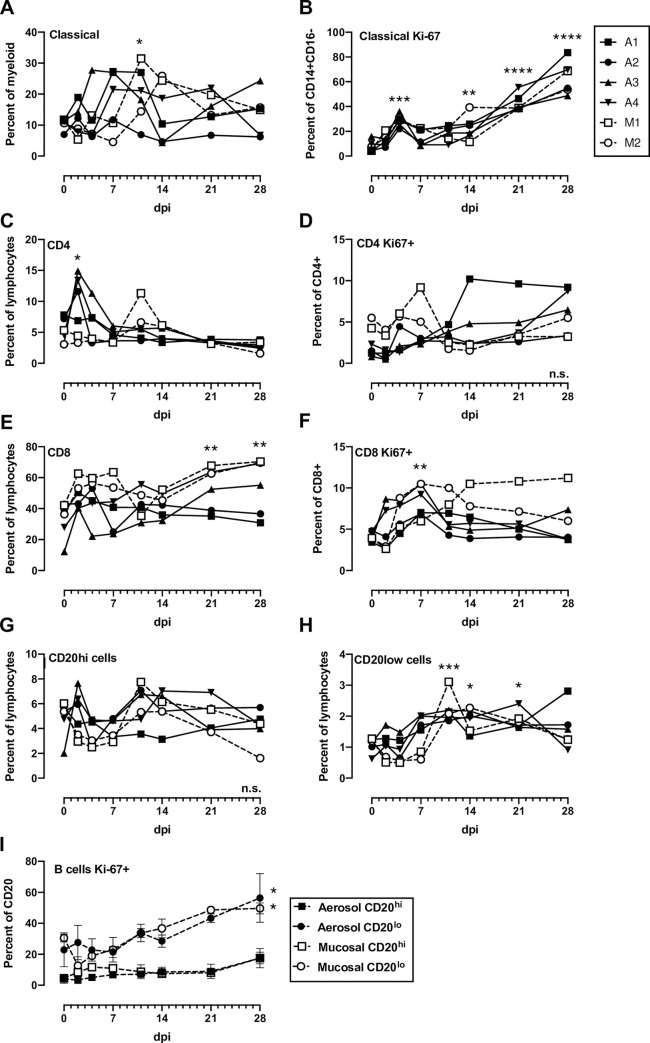
Fig 4. Blood cell populations in SARS-CoV-2 infected AGMs.
(A) Classical monocytes (CD14+CD16-), (B) Ki-16+ classical monocytes, (C) CD4+ T cells, (D) CD4+Ki-67+ cells, (E) CD8+ T cells, (F) CD8+Ki-67+ cells, (G) B cells with high CD20 expression, (H) B cells with low CD20 expression (plasmablasts), (I) Grouped expression of Ki-67 on CD20hi and CD20lo (plasmablast) populations. 2-way ANOVA with multiple comparisons was used to determine statistical significance compared to 0 dpi and is indicated by asterisks above each time point. N.s. in the lower right corner indicates no significant differences.

