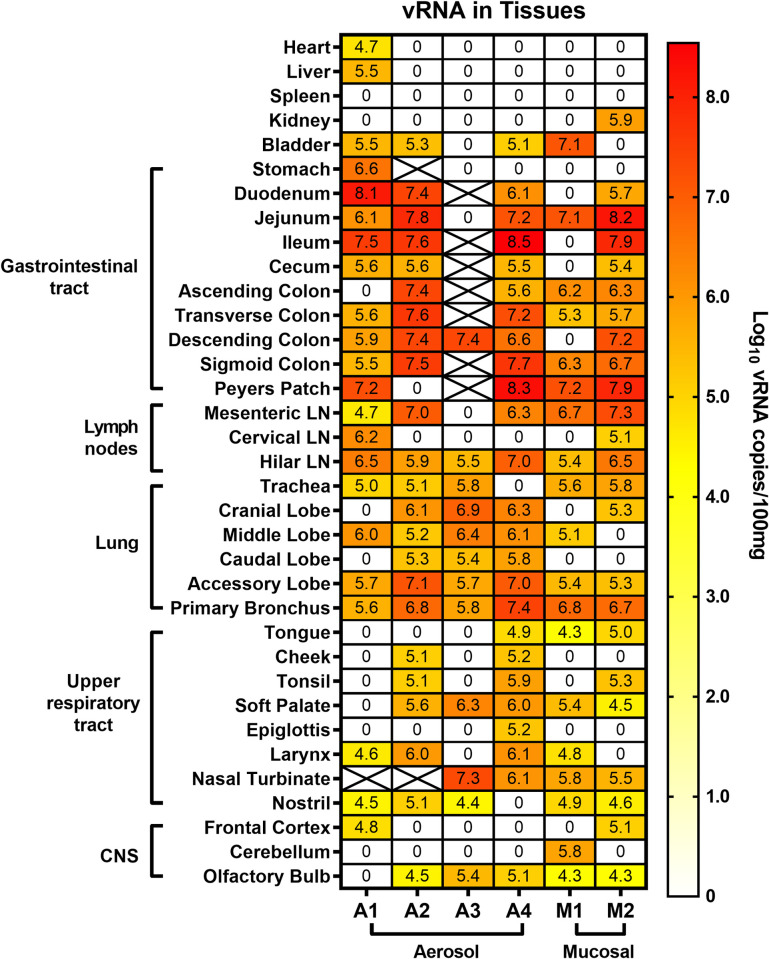
Fig 6. Viral RNA within tissues of SARS-CoV-2 infected AGM.
Animals underwent necropsy at 28 dpi (35 dpi for A1 and A2) and the indicated tissues were extracted and tested for viral RNA by q-RT-PCR. Heat map shows the log-transformed vRNA copies per 100 mg of tissue. X indicates the sample was not available or not tested.

