Figure 1.
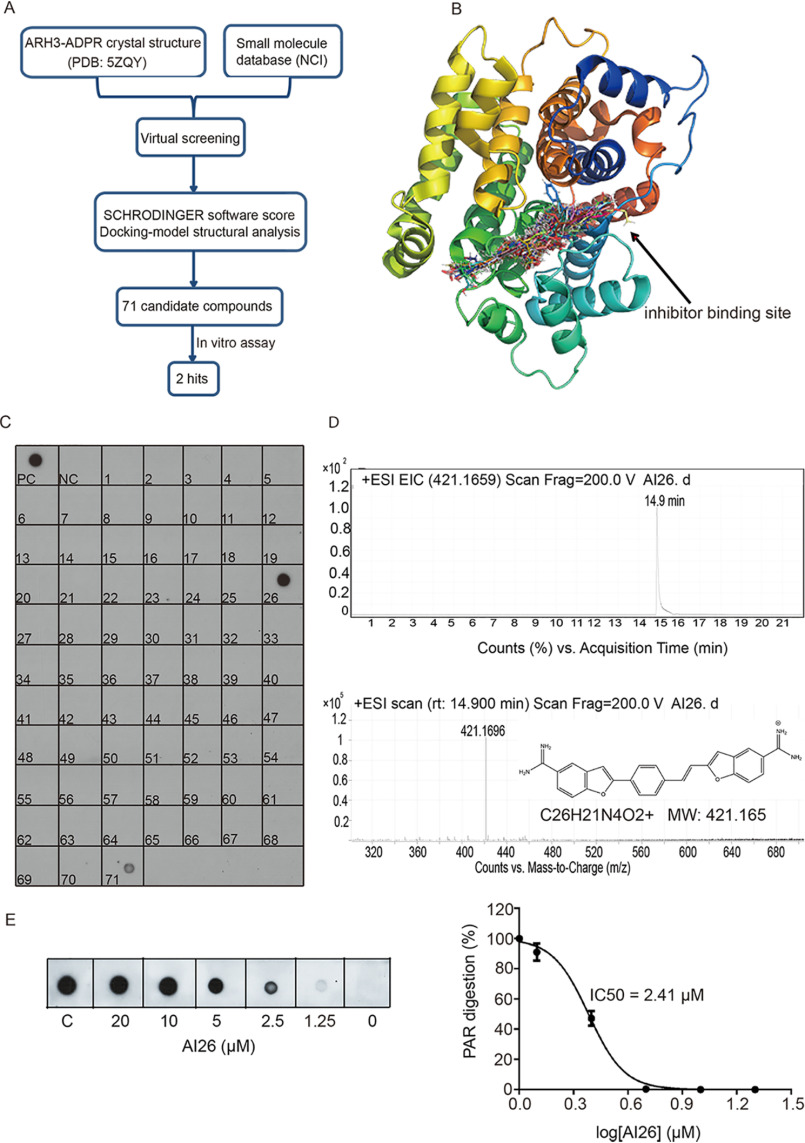
Identification of ARH3 small-molecule inhibitors. A, a diagram of screening approach for the ARH3 inhibitors. B, the docking models of small molecules fitting into the catalytic pocket of ARH3. The structure of ARH3 is displayed in rainbow cartoon, and the small molecule compounds are shown in stick. C, biochemical screening of the ARH3 inhibitor. 71 candidates from NCI library were examined. ARH3 (1 μm) was incubated with PAR (10 μm) for 30 min at room temperature in the presence of each compound (100 μm). PAR digestion results were measured by dot-blotting assays with anti-PAR antibody. PC and NC indicate the positive control and negative control, respectively. D, AI26 was examined by LC–MS. From top to bottom, HPLC chromatogram, extracted ion chromatogram, and chemical structure of AI26. EIC, extracted ion chromatogram, ESI, electron spray ionization, MW, molecular weight. E, the estimated IC50 of AI26 was calculated from the in vitro PAR digestion assay (n = 3 independent experiments). AI26 with the indicated concentration was incubated with ARH3 (0.5 μm) and PAR (10 μm). The dot-blotting assays were performed with anti-PAR antibody to examine the in vitro PAR digestion. The IC50 value was determined using GraphPad Prism 7 software and the equation: log (inhibitor) versus normalized response – variable slope.

