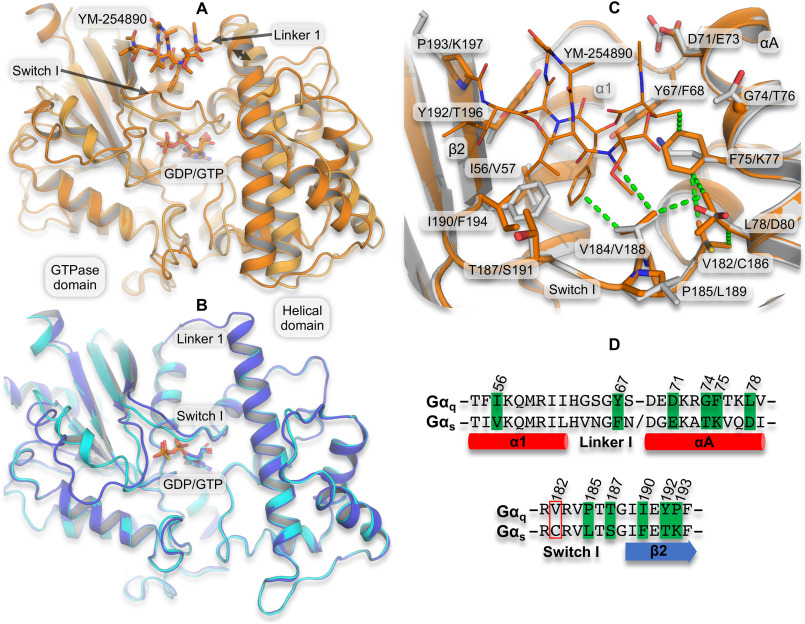
Figure 1.
Structural effect of inhibitor binding and differences in the YM-254890/FR900359 binding site between Gq and Gs. A, superimposition of YM-254890–bound Gαq (dark orange carbon atoms and cartoon representation, YM-254890 and GDP as sticks; PDB code 3AH8) and the GDP/Al4+-activated Gαq without inhibitor (light orange carbon atoms and cartoon representation; PDB code 5DO9) based on the GTPase domain shows a 2.8-Å inhibitor-induced shift in the relative location of the helical domain (double arrow). B, superimposition of the inactive GDP-bound Gs (purple carbon atoms and cartoon; PDB code 6EG8) and the GTPγS-activated Gs (cyan carbon atoms and cartoon; PDB code 1AZT) shows practically identical relative location of the GTPase and helical domains. C, the depsipeptide-binding site in YM-254890-bound Gαq (as in A) superimposed on a homology model of Gαs (gray carbon atoms and cartoon) highlighting (sticks) the binding site residues (within 6 Å and side chains pointing toward YM-254890) that differ between Gαq and Gαs. Val-182/Cys-186 is included, as it is part of a hydrophobic network of amino acids having close vdW contact with each other and with YM-254890 (dotted lines). Labels indicate one-letter amino acid codes and numbers in Gq/Gs. D, sequence alignment of the YM-254890–binding site region in Gαq and Gαs, highlighting differing binding site residues (green). Residues in the red box are not part of the binding site but the hydrophobic network. Sequence numbers are from Gq.

