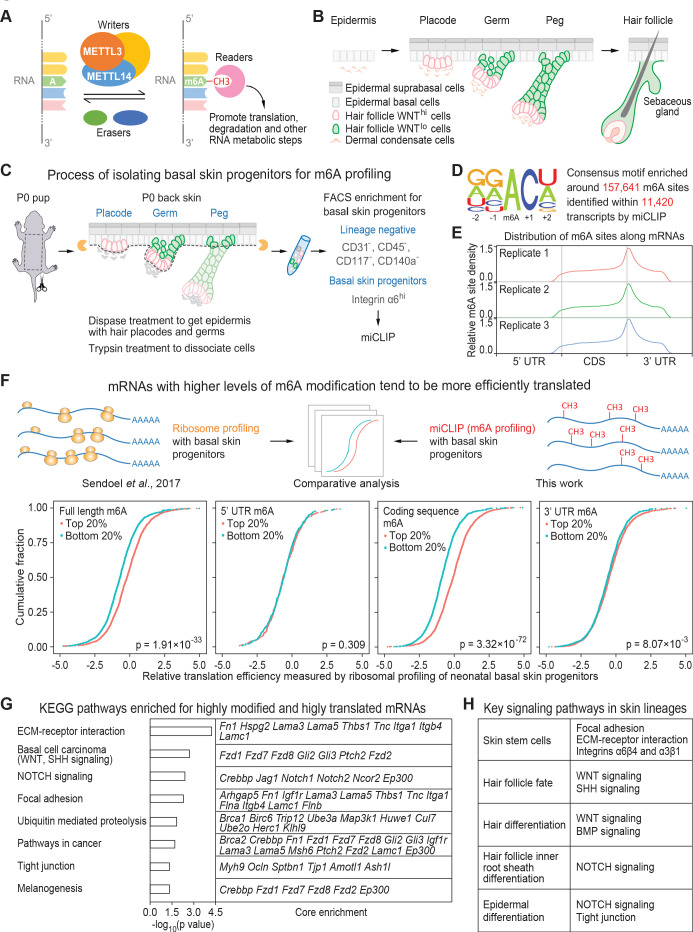
Figure 1. miCLIP and ribosomal profiling analyses of the mouse skin epithelial progenitors.
(A) Schematic depicting the major factors involved in regulating the cellular dynamics of m6A modification. (B) Schematic depicting embryonic development of mammalian epithelial skin progenitors. WNThi/lo implies cells that show strong WNT or low WNT signaling as judged by Axin2-LacZ transgene expression (Matos et al., 2020). HF morphogenesis occurs in temporal waves, with mature HFs emerging shortly after birth. (C) Schematic depicting the process for enzymatically isolating epithelial progenitors from mouse skin at age P0. For miCLIP, cells were subjected to FACS purification as described in the Materials and methods. (D) Consensus sequence motif enriched around miCLIP-identified m6A sites in P0 skin progenitor mRNAs. (E) Metagene plots depicting the distribution of miCLIP-identified m6A sites along mRNAs. Data from three independent replicates are shown. (F) Schematic depicts comparison of the miCLIP data, which measures m6A modification to the ribosome profiling data, which landscapes bound ribosomes on neonatal skin progenitor mRNAs. The empirical cumulative distribution function (ECDF) plots compare the relative mRNA translation efficiency of the top 20% and bottom 20% of m6A-modified mRNAs. The data reveal that transcripts with higher levels of m6A modification (assessed by the sum of normalized-to-input uTPM value of m6A along the full-length transcript) tend to have higher levels of translation efficiency. The correlation between translation efficiency and the sum of normalized-to-input uTPM value of m6A at different regions of the mRNAs (5’ UTR, coding sequence, 3’ UTR) shows that the coding sequence m6A gives the best correlation to translation efficiency. The p values were calculated through Wilcoxon rank sum test. (G) GSEA of the overlap between mRNAs that are the top 20% heavily m6A-modified in coding sequence (assessed by the sum of normalized-to-input uTPM value of m6A along coding sequence) and the top 20% most efficiently translated mRNAs (assessed by ribosome profiling). Shown are the top eight enriched KEGG signaling pathways, each of which has a p value <0.05 and >5 enriched mRNAs. (H) Pathways known to play essential roles in regulating skin lineage specification.


