. 2020 Aug 26;9:e56980. doi: 10.7554/eLife.56980

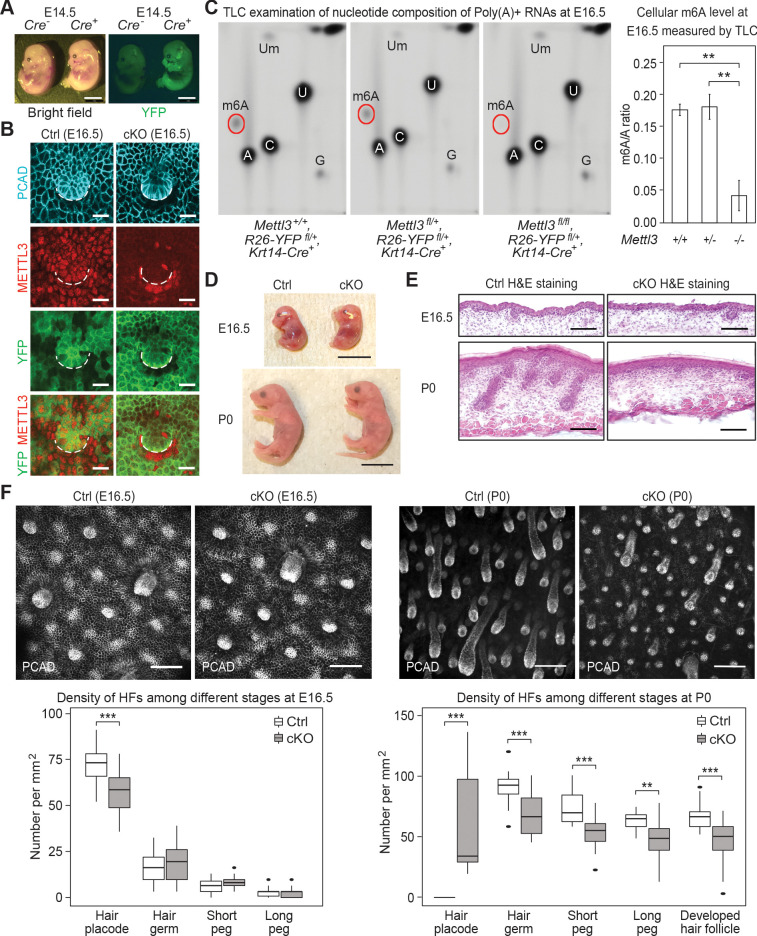
Figure 2. Krt14-Cre driven conditional Mettl3 knockout mice display severe defects in HF morphogenesis.

(A) Representative pictures of Krt14-Cre-/-, Rosa26-YFPfl/+ and Krt14-Cre+/-, Rosa26-YFPfl/+ littermate embryos demonstrating the onset of uniform YFP expression in the E14.5 skin epithelium (scale bars: 2 mm). (B) Confocal images of E16.5 whole-mount back skin immunolabeled for P-cadherin (PCAD), METTL3 and YFP (scale bars: 20 µm). Note that nuclear METTL3 immunofluorescence is selectively depleted from the YFP+ cells in cKO skin. White dashed lines denote the dermal-epidermal border. (C) Left panel: representative pictures of thin layer chromatography (TLC) on Poly(A)+ RNA samples isolated from E16.5 skin epithelial cells. Right panel: quantification of m6A levels based on TLC (error bars: standard deviation, for Mettl3+/+ n = 2 biological replicates, for each of the other conditions n = 3 biological replicates, **p<0.01 by unpaired two-tailed Student’s t-test). (D) Representative pictures of E16.5, P0 control and cKO littermates (scale bars: 1 cm). (E) Hematoxylin and eosin (H and E) stained back skin sagittal sections at indicated time points (scale bars: 100 µm). (F) Confocal images of whole-mount back skin immunolabeled for PCAD at indicated time points (scale bars: 100 µm) and quantification of HFs at different developmental stages (for E16.5, n = 3 biological replicates ×10 images per replicate and for P0, n = 18 images from four biological replicates, **p<0.01 and ***p<0.001 by unpaired two-tailed Student’s t-test).

Figure 2—source data 1. Quantification of m6A/A ratio through TLC signals in (C).
Figure 2—source data 2. Quantification of HF density in (F).

Figure 2.

Figure 2—figure supplement 1. Breeding strategy to generate the Mettl3 cKO animals and the control (Ctrl) littermates.
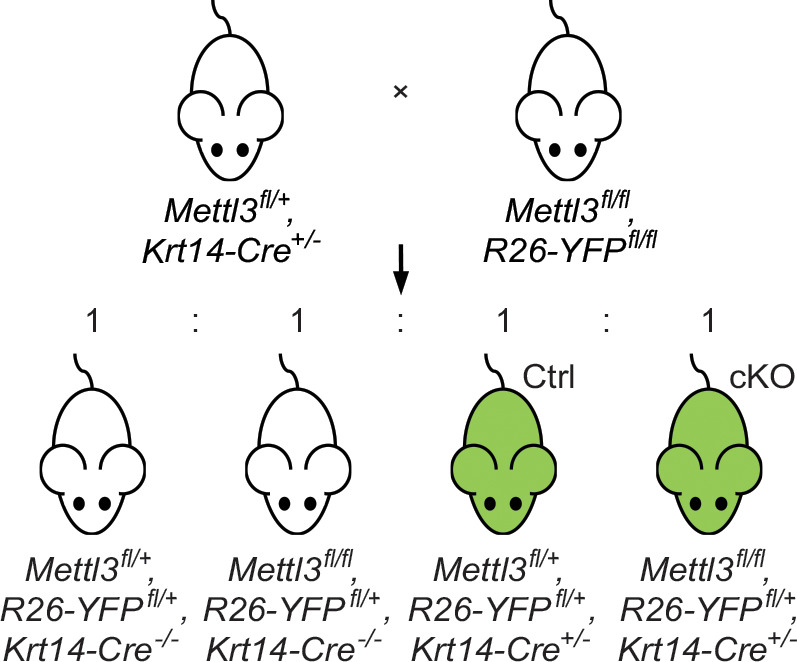
Figure 2—figure supplement 1.

By mating the Mettl3+/fl, K14-Cre+/- and Mettl3fl/fl, Rosa26-YFPfl/fl breeders, we got offspring with 4 kinds of genotypes being born at Mendel’s ratio, among which Mettl3+/fl, Rosa26-YFP+/fl, K14-Cre+/- and Mettl3fl/fl, Rosa26-YFP+/fl, K14-Cre+/- littermates were used as control (Ctrl) and conditional knockout (cKO) objects for our study.
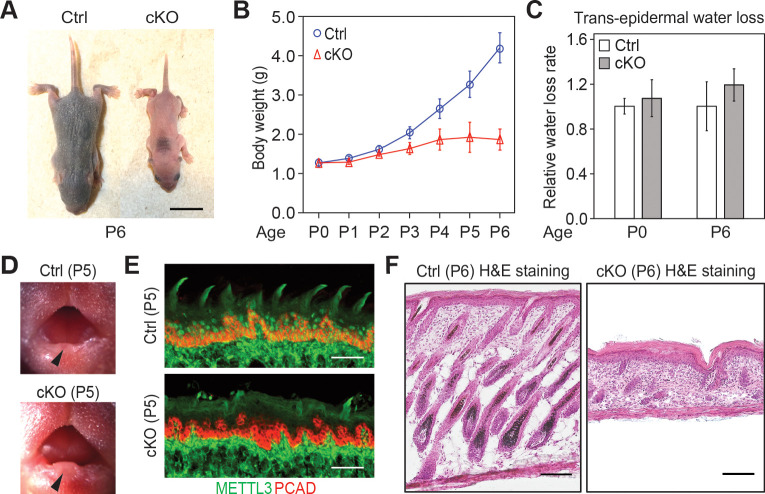
Figure 2—figure supplement 2. Additional information on the Mettl3 cKO phenotypes.

Figure 2—figure supplement 2.

(A) Representative pictures of P6 control and cKO littermates (scale bars: 1 cm). (B) Quantification of body weights of control and cKO littermates (error bars: standard deviation, for each condition n = 5 biological replicates from three litters). (C) Measurements of TEWL (error bars: standard deviation, for each condition n = 4 biological replicates, for the comparison between control and cKO at each time point, p>0.05 by unpaired two-tailed Student’s t-test). (D) Representative pictures of P5 pups’ mouths demonstrating the growth of the teeth (black arrows). (E) Images of P5 tongue sagittal sections immunolabeled for METTL3 and PCAD demonstrating the tongue surface of the Mettl3 cKO animals tends to be smoother than that of the control animals, which suggests filiform papillae are not well-formed in the cKO animals (scale bars: 50 µm). (F) Hematoxylin and eosin (H and E) stained P6 back skin sagittal sections (scale bars: 100 µm).
Figure 2—figure supplement 2—source data 1. Quantification of neonates' body weights in (B).
Figure 2—figure supplement 2—source data 2. Quantification of TEWL in (C).