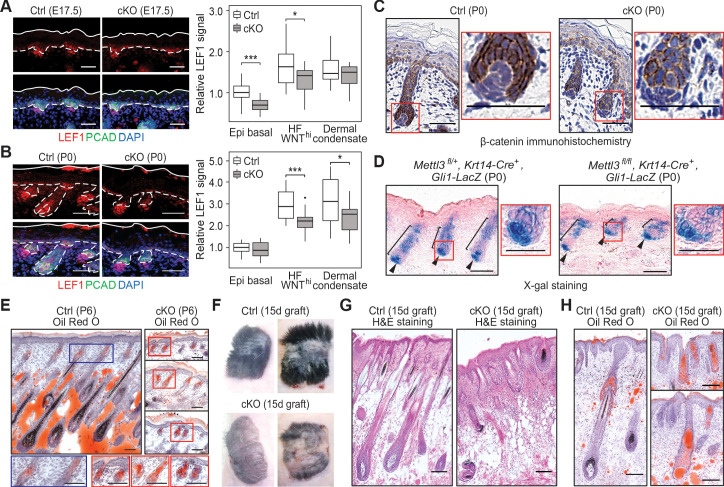
Figure 3. Loss of m6A results in diminished WNT signaling and signs of perturbed HF fate.
(A) Left panel: representative images from E17.5 sagittal sections immunolabeled for LEF1 and PCAD (scale bars: 50 µm). White solid lines denote skin surface and dashed lines denote dermal-epidermal border. Right panel: quantification of LEF1 immunofluorescence at indicated compartments (for each condition n = 3 biological replicates ×7 images per replicate, *p<0.05 and ***p<0.001 by unpaired two-tailed Student’s t-test). (B) Left panel: representative images from P0 sagittal sections immunolabeled for LEF1 and PCAD (scale bars: 50 µm). Solid and dashed lines as in (A). Right panel: quantifications of LEF1 immunofluorescence in indicated compartments (for each condition n = 3 biological replicates ×7 images per replicate, *p<0.05 and ***p<0.001 by unpaired two-tailed Student’s t-test). (C) Representative images from P0 sagittal sections with immunohistochemistry staining of β-catenin, counter-stained with hematoxylin (scale bars: 50 µm). (D) Representative images from P0 sagittal sections stained with X-gal and nuclear fast red to examine the expression of the Gli1-LacZ transgene, a proxy for SHH signaling (scale bars: 100 µm). (E) Representative images from P6 sagittal sections stained with Oil Red O and counterstained with hematoxylin to visualize signs of HF to sebocyte fate switching within the epithelium (scale bars: 100 µm). The staining in the control dermis reflects adipocyte-derived lipids, missing in the cKO pups, which lose weight after birth. (F) Representative pictures of control (Ctrl) and cKO back skins engrafted onto Nude (Nu/Nu) mice and analyzed 15 days later. (G) Representative Hematoxylin and eosin (H and E) stained sagittal sections of 15-dayengrafted back skins (scale bars: 100 µm). (H) Representative sagittal sections as in (G) and counterstained with Oil Red O and hematoxylin (scale bars: 100 µm).
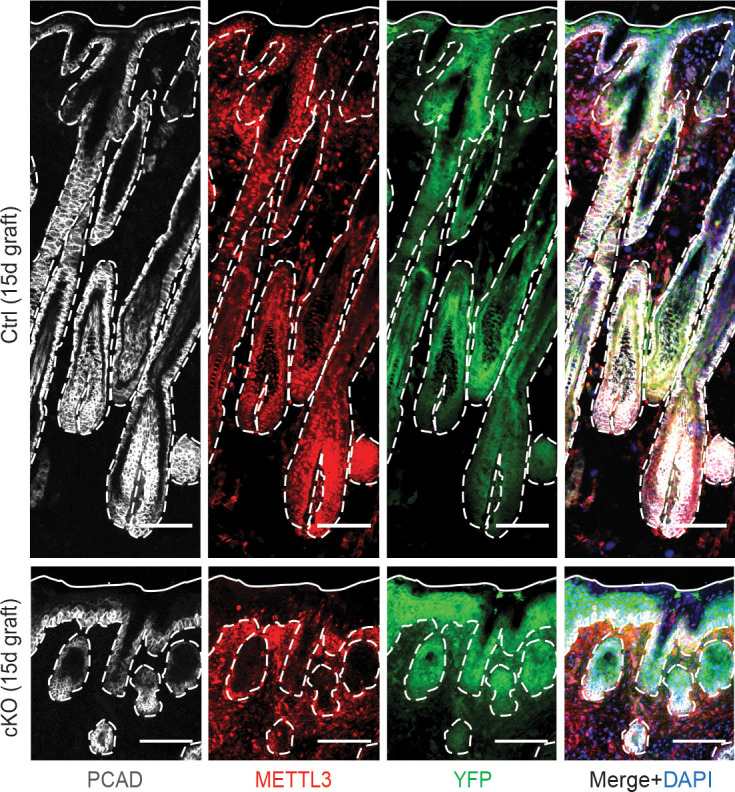
Figure 3—figure supplement 1. Examination of METTL3 and YFP expression in the grafted skin.


