. 2020 Aug 26;9:e56980. doi: 10.7554/eLife.56980

Figure 4. Perturbations in WNT-driven dermal papilla engulfment and in actin-mediated cellular polarity within Mettl3 cKO HFs.

(A) Ultrastructure of HF in control and Mettl3 cKO mice in P0 back skin. Matrix (Mx) cells engulf the dermal papilla (DP, colored in pink) in the control HF but often fail to do so in the cKO. Dashed line indicates the boundary between matrix and dermal papilla. The boundary between dermal papilla cell #1 and matrix cell #2 is magnified in the panel below. BM, basement membrane. Scale bars: 10 µm (upper panel), 600 nm (lower panel). Ap, apoptotic bodies. (B) Representative images from P0 sagittal sections labeled for F-actin by phalloidin (scale bars: 25 µm). White solid lines denote skin surface and dashed lines denote dermal-epidermal border. Note apical polarization of F-actin in control HFs, often missing in Mettl3 cKO follicles.
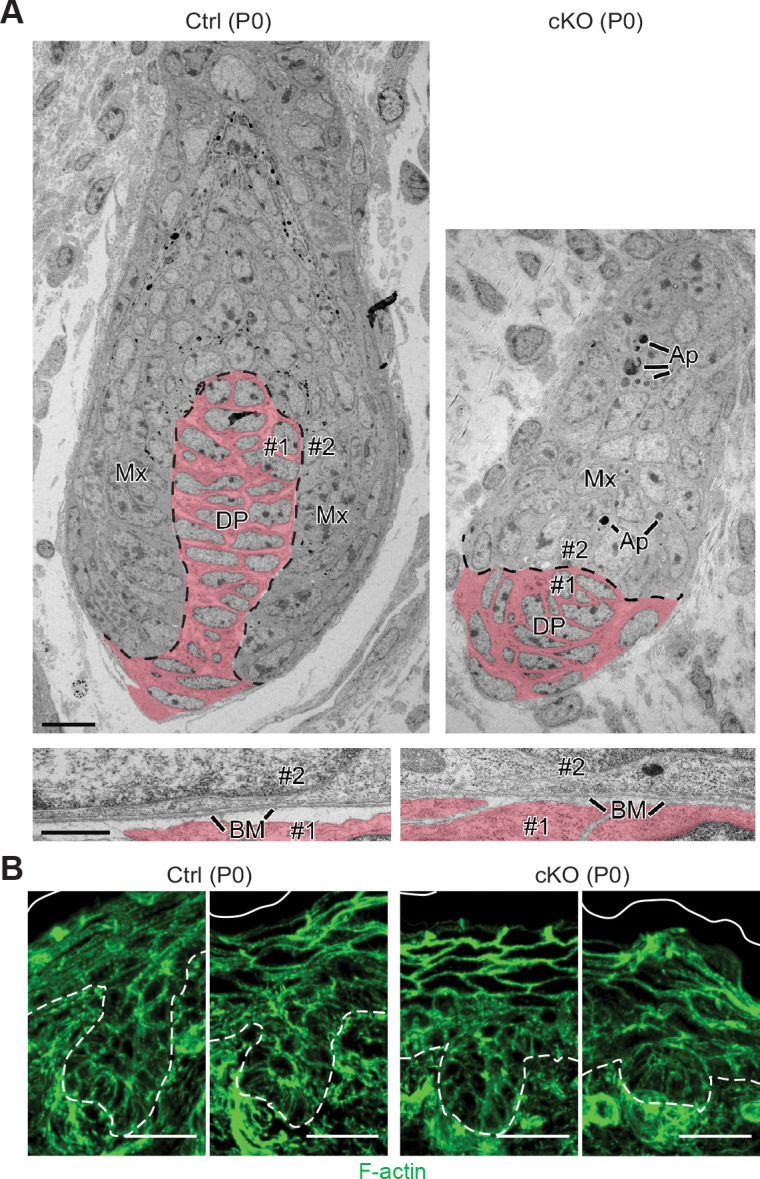
Figure 4.

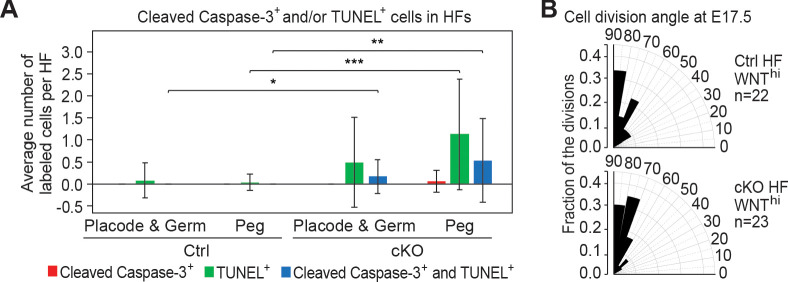
Figure 4—figure supplement 1. Analysis of DNA fragmentation, apoptosis and cell division angles in HF morphogenesis.

Figure 4—figure supplement 1.

(A) Quantification of TUNEL+ and cleaved Caspase-3+ cells in HFs at different developmental stages [placodes (Plcd), germs and pegs] at P0. Quantifications are from images of P0 sagittal sections immunolabeled for cleaved Caspase-3 and stained for TUNEL (error bars: standard deviation, for each condition >25 HFs from 3 biological replicates were analyzed, *p<0.05 **p<0.01 ***p<0.001 by unpaired two-tailed Student’s t-test). Double-staining is indicative of apoptosis, while TUNEL positivity on its own represents increased DNA fragmentation, which could be indicative of cytolysis or other forms of DNA damage. (B) Radial histograms depicting the spindle orientations of HF WNThi cells during anaphase/telophase at E17.5, assessed by triple immunofluorescence for Survivin, integrin β4 (CD104) and PCAD as described in Ouspenskaia et al., 2016; Williams et al., 2011. For each condition, three biological replicates are analyzed and n indicates the total number of anaphase/telophase cells examined.
Figure 4—figure supplement 1—source data 1. Quantification of cell death events in HFs in (A).
Figure 4—figure supplement 1—source data 2. Quantification of cell division angles in (B).