. 2020 Aug 26;9:e56980. doi: 10.7554/eLife.56980

Figure 5. Single-cell transcriptomics of Mettl3 cKO compared to control skin epithelial lineages.

(A) YFP+ progenitors were FACS-enriched from E17 control and Mettl3 cKO whole back skins and subject to scRNA-seq as described in the Materials and methods. Shown are the data from unbiased clustering of the single cells projected by t-SNE. (Clustering was performed on all cells from control and cKO samples pooled together.) Seven major clusters and three minor clusters were identified, which are present in both samples. (B) Heat map illustrating how the seven populations were identified based upon their expression of established marker genes. Each column depicts data from one single cell belonging to the cluster that is indicated at the top. Each row illustrates cluster-wide expression data for the specific mRNA listed at the right. Color coding of each cluster is according to the color scheme in the t-SNE plots in (A). (C) Pseudotime plots showing the estimated lineage trajectories of each of the clusters as derived from the scRNA-seq data. The p values were calculated through Pearson's chi-square test.

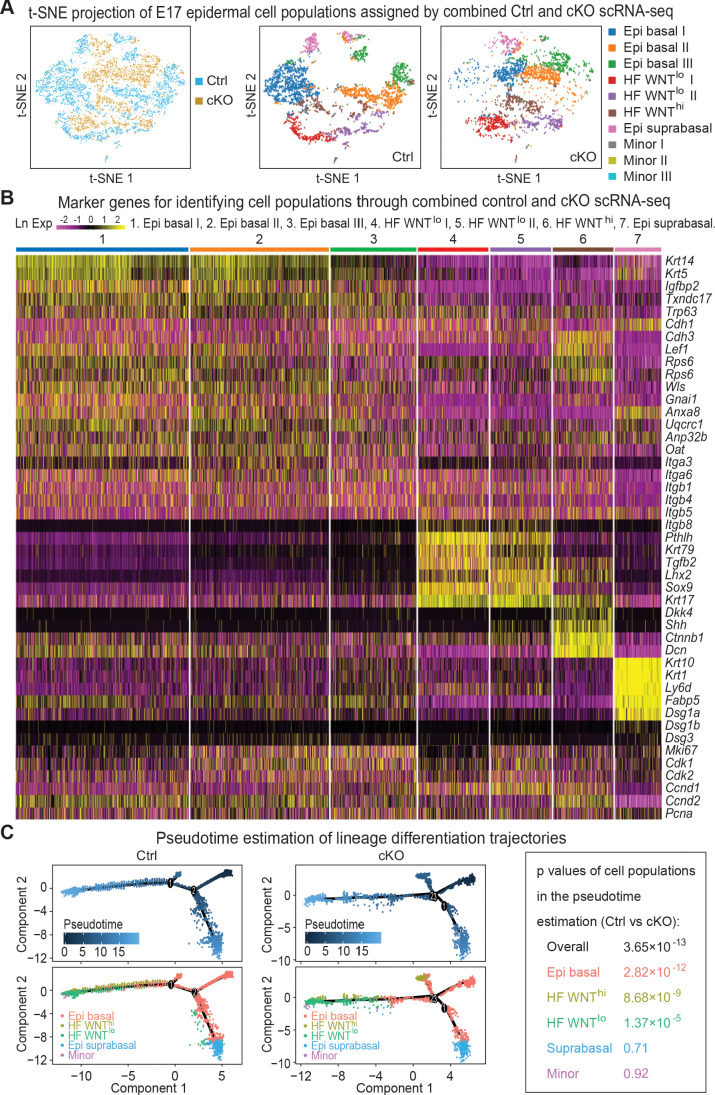
Figure 5.

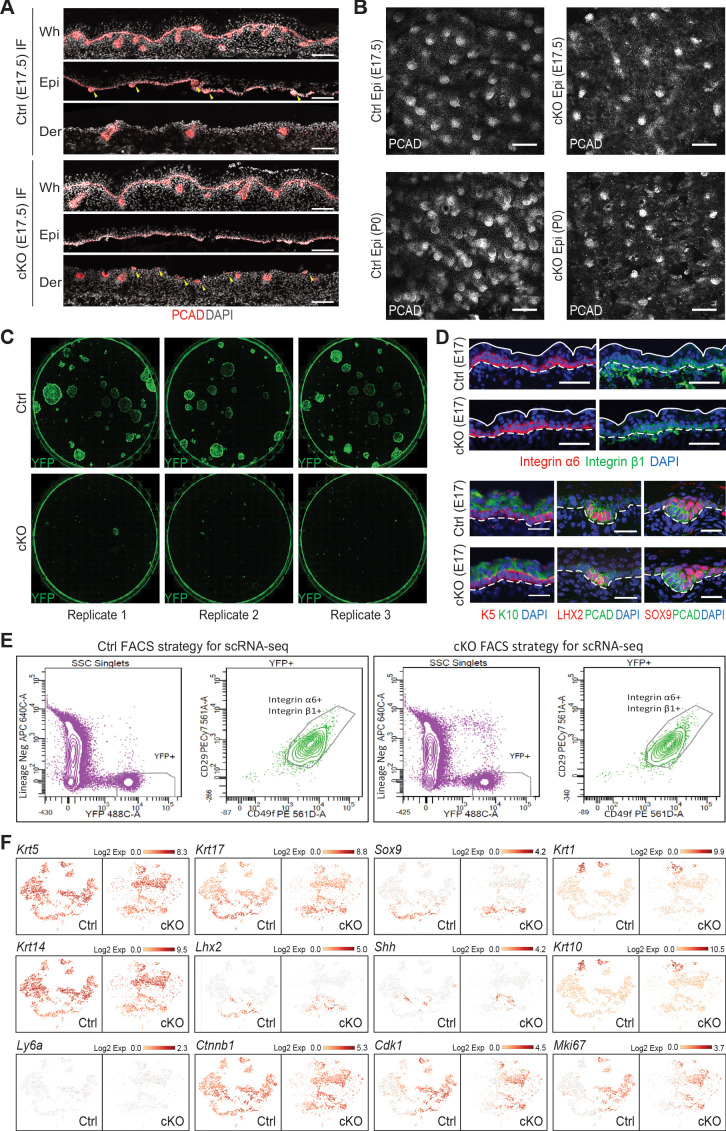
Figure 5—figure supplement 1. Cell isolation for scRNA-seq analysis and cell identity verification.

Figure 5—figure supplement 1.

(A) Images of E17.5 back skin sagittal sections before (whole skin, Wh) and after dispase treatment immunolabeled for PCAD demonstrating Mettl3 cKO affects the separation of developing HFs between the epidermis (Epi) and dermis (Der) fractions (scale bars: 100 µm). Yellow arrows are pointing to the hair placodes and hair germs, which were found in the epidermal fraction in the control sample but the dermal fraction the cKO sample. (B) Confocal images of the epidermis fractions separated by dispase treatment immunolabeled for PCAD at indicated time points (scale bars: 100 µm). (C) Colony formation assay demonstrating cKO cells do not survive in vitro culturing conditions. Each picture was scanned from a well of 6-well plates with YFP+ cells FACS isolated from E16.5 back skin cultured for 10 days. Cells were then fixed and immunolabeled for YFP. Shown are representative images. (D) Images of E17.5 back skin sagittal sections immunolabeled for selected lineage markers (for integrins α6, β1, scale bars: 50 µm; for the others scale bars: 25 µm). White solid lines indicate skin surface and dashed lines indicate dermal-epithelial border. (E) Sorting strategy to isolate YFP+ epidermal cells for scRNA-seq analysis. Live (DAPI-) cell singlets were first gated upon the lineage negative markers and YFP signal to get the YFP+ population. The YFP+ population was further gated on surface integrins α6 (CD49f) and β1 (CD29) to enrich for skin progenitors, which were collected for scRNA-seq. (F) t-SNE plots to visualize the expression of selected marker genes. See legend of Figure 7C and t.