. 2020 Aug 26;9:e56980. doi: 10.7554/eLife.56980

Figure 6. Investigation of RNAs whose levels diminish upon METTL3 loss.

(A) scRNA-seq data from Figure 5A were binned according to four major classifications: Epi basal, Epi suprabasal, HF WNThi and HF WNTlo. Scatter plots of mRNAs in these cells were then analyzed according to their expression changes (cKO/Ctrl) assessed by scRNA-seq Z score and to their coding sequence m6A density in wild-type (WT) skin epithelium assessed by the miCLIP SN-uTPM per nt value. Dots on the left of the dashed line in each plot indicate RNAs which from scRNA-seq have a Z score (cKO/Ctrl)<−1.96 (Supplementary file 3). Among those, blue dots denote mRNAs with m6A coding sequence SN-uTPM per nt among the top 20% (Supplementary file 4). (B) Major pathways and their associated RNAs that were downregulated upon METTL3 loss. Shown are the data for the basal epidermal progenitors, which at E17 contained both epidermal and hair placode cells. mRNAs highlighted in blue correspond to blue dots in (A), and were among the most significantly downregulated upon METTL3 loss but heavily m6A-modified in wild-type. Note that many of these pathways also corresponded to those whose heavily m6A-modified mRNAs were also efficiently translated. (C) Violin plots illustrating the relative expression levels of Lef1 mRNA in the Mettl3 cKO versus control basal epidermal progenitors and WNThi progenitors. Z score assessment of expressional difference between cKO and control [Z (cKO/Ctrl)] and false discovery rate (FDR) is calculated by MAST. The down-regulation was verified with qPCR on total RNA samples extracted from YFP+ skin epithelial cells FACS isolated from E16.5 embryos with Tbp mRNA as internal control (error bars: standard deviation, for each condition n = 3 biological replicates, **p<0.01 by unpaired two-tailed Student’s t-test). (D) Confocal images of E16.5 whole-mount back skin immunolabeled for HES1 and YFP (scale bars: 20 µm). HES1 expression was quantified in the stratified layers of skin epithelium (middle line corresponds to the mean; for each condition, the data are from two biological replicates; ****p<0.0001 by unpaired two-tailed Student’s t-test). (E) Pulse-chase assay examining the rate of epidermal cell flux from basal to suprabasal layers. Control and cKO animals were pulsed at E18.5 with EdU and the signal was then chased until P1. Before tissue collection, the P1 pups were treated with a short (1 hr) BrdU pulse. P1 back skin sagittal sections were subjected to immunofluorescence to examine the EdU and BrdU labeling in the basal versus suprabasal layers of the epidermis (scale bars: 25 µm). White solid lines denote skin surface and dashed lines denote dermal-epidermal border. Cell flux rates were quantified based on the ratio of EdU+ cells in the suprabasal layer to BrdU+ basal cells (for each condition n = 4 biological replicates ×10 images per replicate, *p<0.05 by unpaired two-tailed Student’s t-test). (F) Radial histograms depicting the division orientation of epidermal basal cells during anaphase/telophase at E17.5 and P0, assessed by IF staining of Survivin, integrin β4 (CD104) and PCAD as described in Williams et al., 2011. For each condition, three biological replicates were analyzed and n indicates the total number of anaphase/telophase cells examined from the embryos. (G) Ultrastructure of epidermis in control and Mettl3 cKO P0 back skin. Ba, basal layer, colored in green; Sp, spinous layer, colored in greenish yellow; Gr, granular layer, colored in yellow; SC, stratum corneum, colored in orange. Note the increased numbers of cells in the spinous layer of cKO, and the presence of nuclei in many cells of the granular layer. The boundary between dermis (Der) and the basal layer is shown in the middle panel. KF, keratin filaments; HD, hemidesmosomes. The border between cell #1 (basal) and cell #2 (suprabasal) is shown in the lower panel. Intercellular membranes are sealed in the control. Note small gaps (arrow) are present at the intercellular border, more frequently in cKO than in control. Scale bars: 10 µm (upper panel), 600 nm (middle and lower panel).

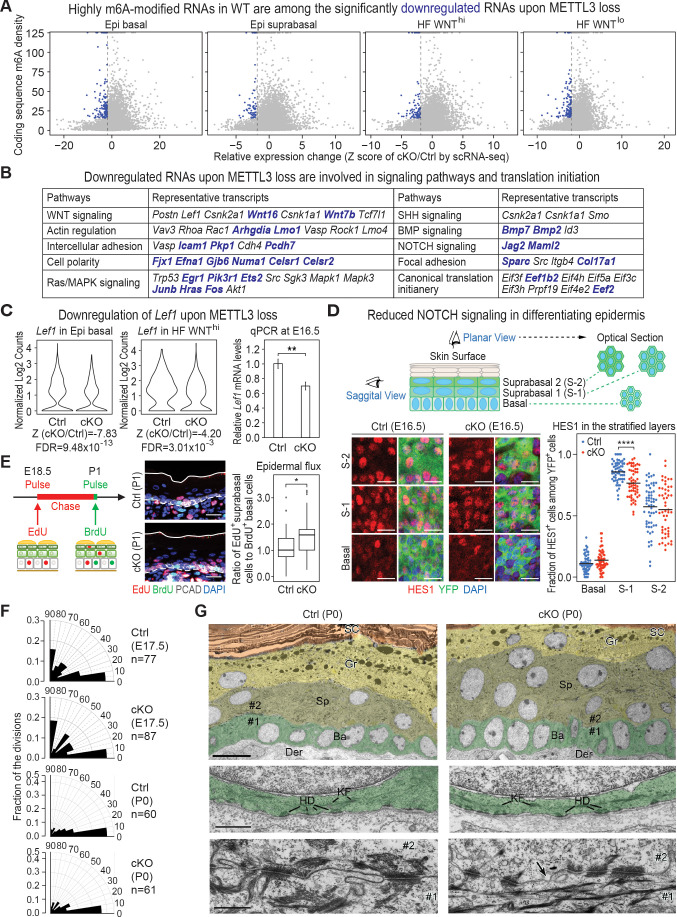
Figure 6—source data 1. Lef1 qPCR in (C).
Figure 6—source data 2. Quantification of HES1 immunofluorescence signals in (D).
Figure 6—source data 3. Quantification of EdU+ and BrdU+ cells in (E).
Figure 6—source data 4. Quantification of cell division angles in (F).

Figure 6.

Figure 6—figure supplement 1. Correlation between the levels of m6A modification and changes in steady-state RNA levels upon Mettl3 ablation.

Figure 6—figure supplement 1.

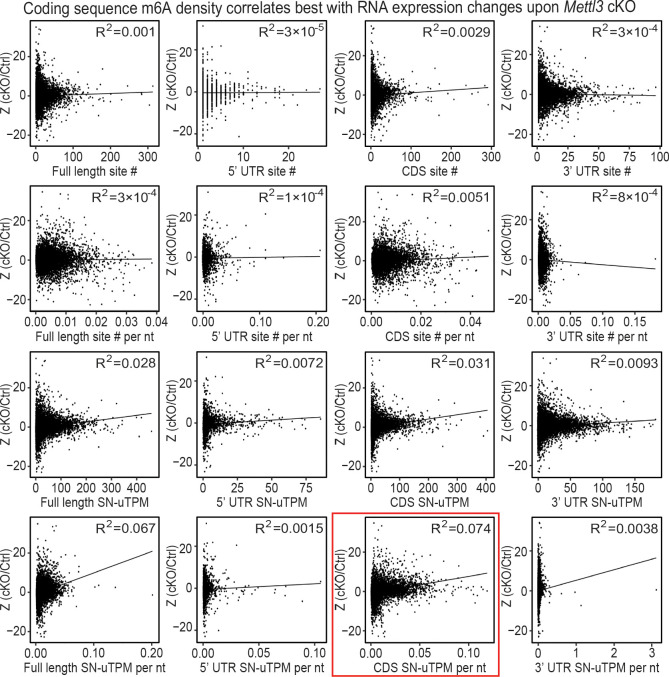
Correlation analysis of the Z score (cKO/Ctrl) from scRNA-seq to different parameters of assessing m6A modification levels. The different parameters tested include m6A site number (site #), m6A site density per nt of RNA (site # per nt), sum of normalized-to-input uTPM from the m6A sites (SN-uTPM) and the SN-uTPM values per nt of RNA (SN-uTPM per nt). For each of the parameter, we also checked the value in the full-length RNA and on the 5’ UTR, coding sequence (CDS), 3’ UTR, respectively. The correlation analysis is performed with Z score (cKO/Ctrl) values from Epi basal, Epi suprabasal, HF WNThi and HF WNTlo groups of cells. In all the four groups, we found the CDS SN-uTPM per nt parameter had the highest level of correlation indicated by the R2 value (boxed in red). Plots that were generated from the Epi basal group of cells are shown.
Figure 6—figure supplement 2. Additional analysis of epidermal perturbations upon Mettl3 cKO.

Figure 6—figure supplement 2.

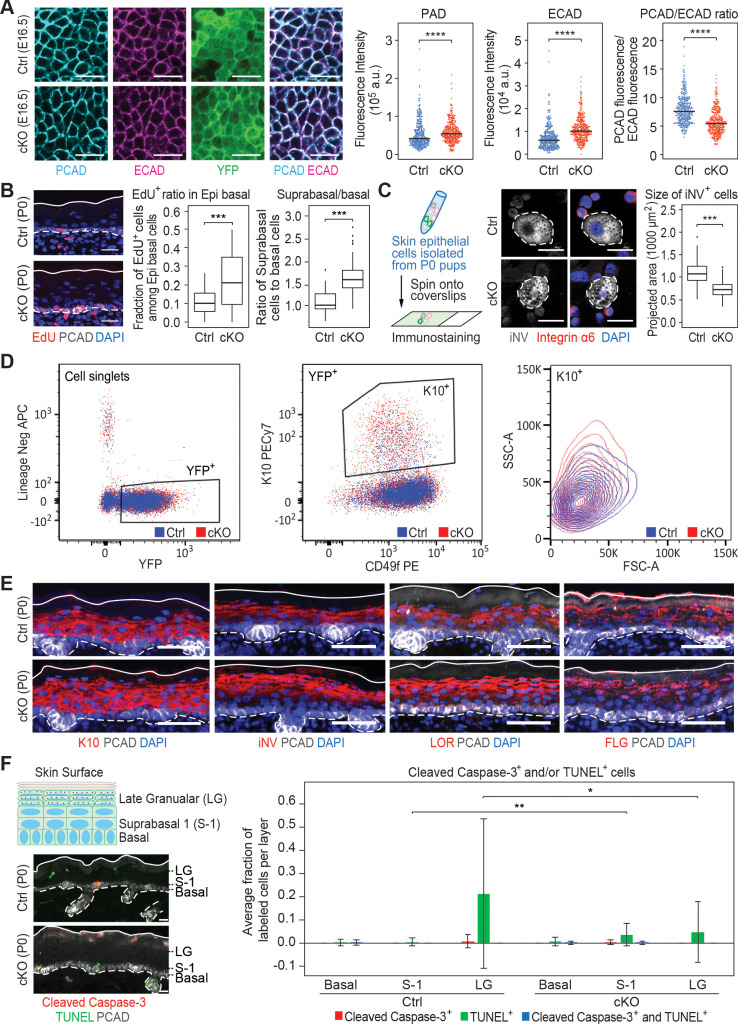
(A) Confocal images of E16.5 whole-mount back skin immunolabeled for PCAD, ECAD and YFP (scale bars: 20 µm). PCAD and ECAD expression was quantified in the basal progenitors of skin epithelium (middle line corresponds to the median; for each condition the data are from two biological replicates; ****p<0.0001 by Mann Whitney test). (B) Left panel: representative images from P0 sagittal sections with a 45-min EdU pulse prior to tissue collection (scale bars: 25 µm). Solid lines, skin surface boundary; dashed lines, dermal-epidermal border. Middle panel: quantification of the ratio of EdU+ cells among all basal cells (for each condition n = 3 biological replicates ×10 images per replicate, ***p<0.001 by unpaired two-tailed Student’s t-test). Right panel: quantification of the suprabasal cell number/basal cell number ratio according to DAPI staining of the nuclei (for each condition n = 5 biological replicates ×10 images per replicate, ***p<0.001 by unpaired two-tailed Student’s t-test). (C) Left panel: schematic depicting process of the cytospin. Middle panel: representative images of differentiated suprabasal keratinocytes from cytospin of epidermal cells (scale bars: 25 µm). Dashed lines highlight differentiated suprabasal keratinocytes with positive involucrin (iNV) immunolabeling and negative integrin α6 immunolabeling. Right panel: quantification of projected area of the iNV+ differentiated cells (for each condition n = 3 biological replicates ×43 cells per replicate, ***p<0.001 by unpaired two-tailed Student’s t-test). (D) Representative flow cytometry analysis of the K10+ suprabasal cells. For each sample, live (Aqua-) cell singlets are first gated upon the lineage negative markers and YFP signal to get the YFP+ population. The YFP+ population is further gated upon surface integrin α6 (CD49f) and K10 immuno-staining signals to get the K10+ population, which is then projected upon forward scatter (FSC-A)/side scatter (SSC-A) for analysis. Forward scatter reflects cell size, with higher value corresponding to bigger size. Side scatter reflects cell shape. As more differentiated suprabasal cells are more granular, they tend to have higher SSC-A values. Comparison between the control and cKO K10+ cells’ profiles indicates that cKO has more highly differentiated cells than control and these highly differentiated cells in cKO animals tend to have smaller sizes. Totally four biological replicates were examined for each condition. Shown are representative results. (E) Images of P0 back skin sagittal sections immulabeled for K10, involucrin (iNV), loricrin (LOR) and filaggrin (FLG) demonstrating the expression pattern of standard differentiation markers is not severely interrupted by Mettl3 cKO (scale bars: 50 µm). Solid and dashed lines as in (B). (F) Representative images of P0 back skin sagittal sections with cleaved Caspase-3 immunostaining and TUNEL staining (scale bars: 20 µm). White solid lines indicate skin surface and dashed lines indicate dermal-epithelial border. Quantification of TUNEL+ and cleaved Caspase-3+ cells in the designated layers at P0. Only double-positive cells denote apoptosis; TUNEL+ only cells are typically seen as granular cells lose their nuclei and transition as dead flattened cells to the stratum corneum. This is defective in Mettl3 cKO skin. The TUNEL+ cells in the suprabasal 1 layer likely correspond to the occasional cytolytic suprabasal cells that we saw at the ultrastructural level (not shown). Quantification of the labeled cells is shown (error bars: standard deviation, for each condition n = 3 biological replicates × 10 images per replicate, *p<0.05 and **p<0.01 by unpaired two-tailed Student’s t-test).
Figure 6—figure supplement 2—source data 1. Quantification of PCAD, ECAD immunofluorescence signals in (A).
Figure 6—figure supplement 2—source data 2. Quantification of EdU+ cells and the suprabasal/basal cell number ratio in (B).
Figure 6—figure supplement 2—source data 3. Quantification of cell sizes by cytospin in (C).
Figure 6—figure supplement 2—source data 4. Quantification of cell death events in epidermis in (F).