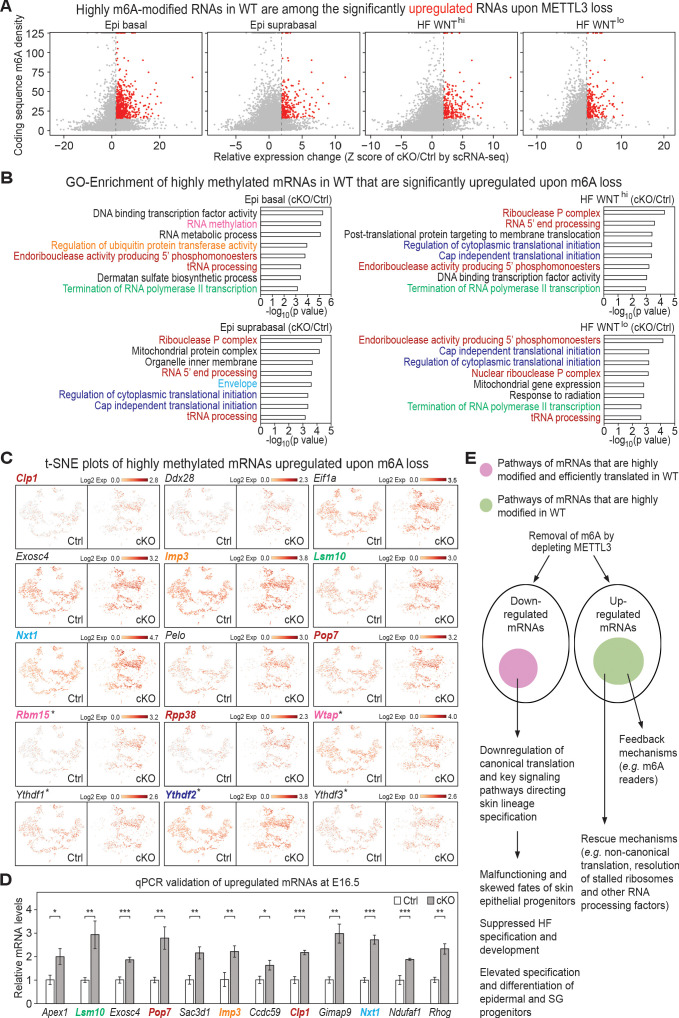
Figure 7. Investigation of RNAs upregulated upon METTL3 loss.
(A) Scatter plots of mRNAs in the indicated groups of cells (as in Figure 5A) based on expression changes (cKO/Ctrl) assessed by scRNA-seq Z score and correlated with the coding sequence m6A density in wild-type (WT) skin epithelium assessed by the miCLIP SN-uTPM per nt value. Dots on the right of the dashed line in each plot indicate RNAs which from scRNA-seq have a Z score (cKO/Ctrl)>1.96 (Supplementary file 3). Among those, red dots denote mRNAs whose m6A coding sequence SN-uTPM per nt was among the top 20% (Supplementary file 4). (B) GSEA of transcripts with Z score (cKO/Ctrl)>1.96, FDR <0.05 in scRNA-seq and m6A coding sequence SN-uTPM per nt among the top 20% indicating the GO terms enriched. (C) Examination of the expression of selected upregulated mRNAs on the t-SNE plots. mRNA names are color-coded according to the GO terms they belong to in (B). Those mRNAs whose names are in black are known to be involved in translation regulation, and scored as elevated significantly upon METTL3 loss. *denotes mRNAs encoding factors related to m6A dynamics. (D) qPCR validation of increased levels of mRNAs in cKO/Ctrl. qPCR is on total RNA samples extracted from YFP+ skin epithelial cells FACS isolated from E16.5 embryos with Tbp mRNA as internal control (error bars: standard deviation, for each condition n = 3 biological replicates, *p<0.05 **p<0.01 ***p<0.001 by unpaired two-tailed Student’s t-test). (E) Proposed model summarizing the effects of m6A loss on mRNA translation and degradation in the skin epithelia, and the consequences to their integrity and fate choices. The ovals represent all mRNAs that were either downregulated or upregulated significantly upon METTL3 loss. Pink circle: by first examining mRNAs that were heavily modified by m6A and also efficiently translated (Figure 1), and then independently identifying mRNAs that were among the most significantly downregulated upon METTL3 loss, we discovered considerable overlap in their pathways, suggestive of a translation block. The finding that a number of mRNAs involved in canonical translation were also significantly downregulated added to this notion. Factors involved in WNT signaling, NOTCH signaling and adhesion were featured prominently, in agreement with the morphogenetic defects observed. Green circle: these mRNAs were significantly upregulated upon METTL3 loss and were heavily m6A-modified in wild-type skin, but they did not correlate with translation efficiency. Rather, they encompassed mRNAs indicative of translational rescue pathways as well as feedback mechanisms.


