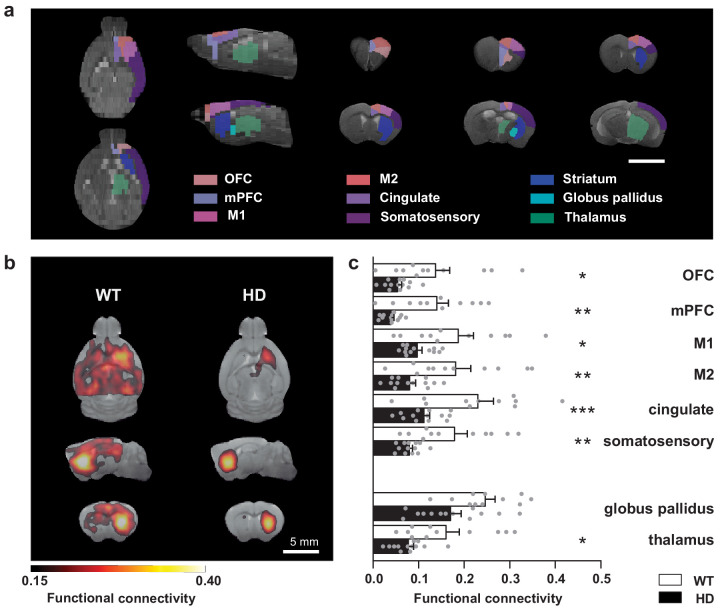
Figure 1. Striatal functional connectivity is reduced in symptomatic HD mice.
(a) We measured the functional connectivity between selected cortical and basal ganglia-related nuclei in the regions of interest obtained by atlas-based automatic parcellation. (b) Average seed-based BOLD correlation maps from striatum in WT and the R6/1 mouse model of HD. The images show the area with an average correlation greater than 0.15. Color maps represent the average correlation value (c) Average functional connectivity of the striatum with selected cortices and basal ganglia related structures from the left hemisphere are represented. For each region, functional connectivity with striatum is computed as the average of the seed-based correlation map in the specific area. Each gray point represents data from an individual mouse. Two-way ANOVA with Bonferroni post hoc comparisons test was performed. Data are represented as mean ± SEM (WT n = 11 and HD n = 13 mice). *p < 0.05, **p < 0.01, ***p < 0.001 HD versus WT.

