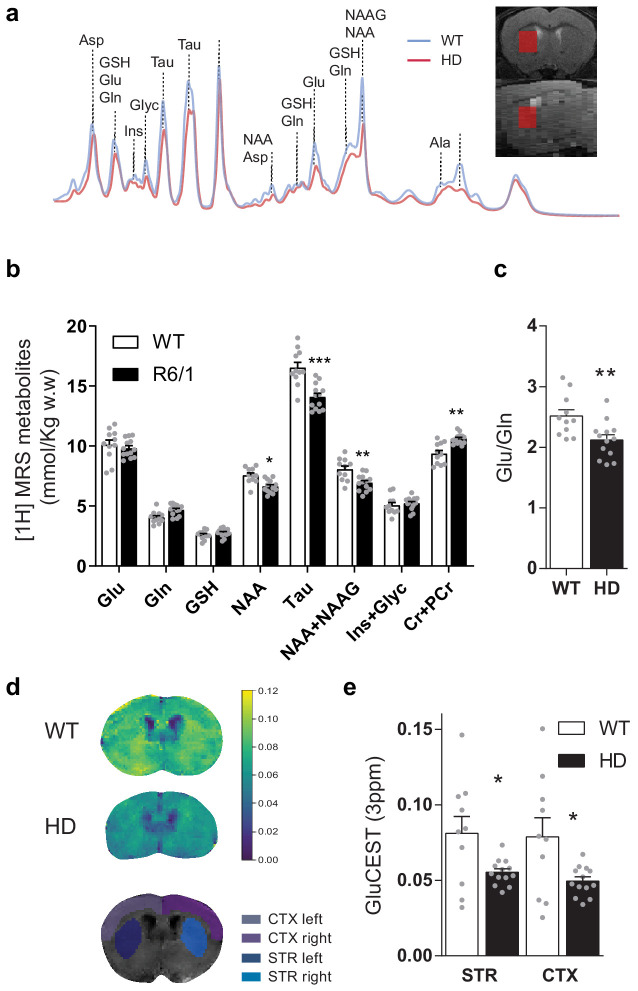
Figure 2. Brain metabolites in the striatum are altered in symptomatic HD mice.
(a) Representative 1H MRS signal from abundant metabolites in the striatum of WT (blue line) and HD (red line) mice. Voxel location in the striatum is illustrated in coronal (top panel) and sagittal brain view (bottom panel). (b) Metabolites concentration quantification (mmol/kg w.w). (c) The glutamate/glutamine ratio was calculated as an indicator of glutamate neurotransmission (d) Representative coronal images of GluCEST in WT (top) and HD mice (middle) and manually drawn ROIs used for quantification (bottom). (e) GluCEST quantification of striatum and cortex. Values were calculated as the GluCEST value (percentage of asymmetry at 3 ppm) versus minimum GluCEST value in the ventricles and left and right hemisphere values were averaged. Data are represented as mean ± SEM (WT n = 10 and HD n = 13 mice). Each gray point represents data from an individual mouse. *p < 0.05, **p < 0.01, ***p < 0.001 HD versus WT. Abbreviations: Glu: glutamate; Gln: glutamine; GSH: glutathione; NAA: N-Acetyl-aspartate; Tau: taurine; NAAG: N-Acetyl-aspartyl-glutamate; Ins+Glyc: inositol + glycine.
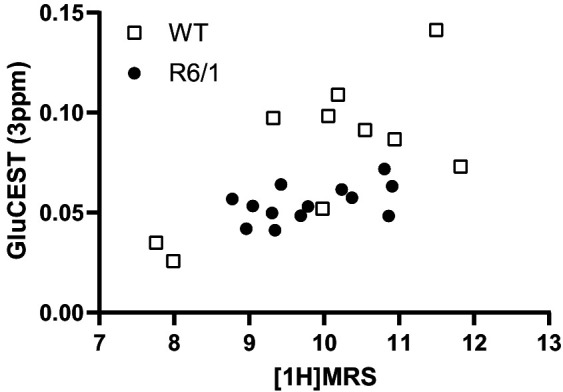
Figure 2—figure supplement 1. Correlation of glutamate levels obtained from GluCEST and 1H MRS in the striatum.


