. 2020 Oct 5;9:e57017. doi: 10.7554/eLife.57017

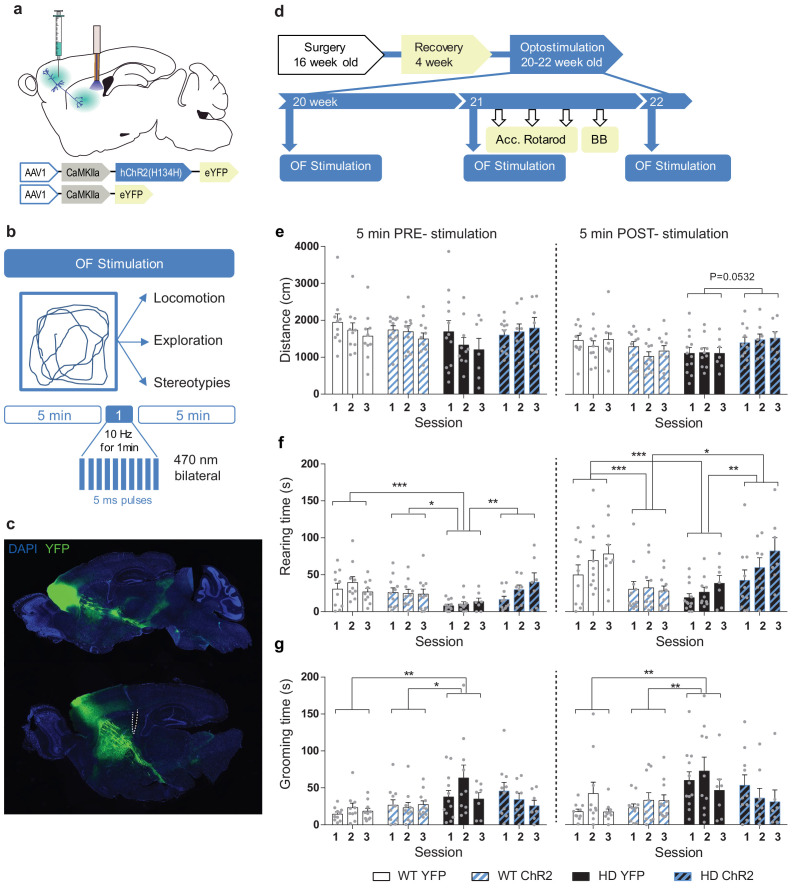
Figure 4. Repeated optogenetic stimulation of the cortico-striatal pathway recovers exploratory and stereotypic behavioral deficits in symptomatic HD mice.

(a) Schematic diagram showing AAV-ChR2 and control AAV-YFP constructs injections at the M2 cortex and fiber-optic cannula implant in the DLS allowing light stimulation of cortically infected neuronal axons. (b) Locomotion (distance traveled), exploration time (rearing time), and stereotypic grooming (grooming time) were evaluated during 11 min open field session. Optogenetic stimulation consisted of 10 Hz light stimulation for 1 min during open field (OF) task. (c) Representative fluorescence image showing the precision of the AAV injection by YFP expression at M2 cortex and the presence of YFP fibers in the striatal region. (d) Surgery, behavior, and optogenetic experimental timeline. The OF procedure was performed at 20 (1st day OF), 21 (2nd day OF), and 22 (3rd day OF) weeks old mice. After 2nd stimulation day, motor learning and coordination tests were performed. (e) Distance traveled, (f) rearing time, and (g) stereotypic grooming were measured during the 5 min before (PRE-stimulation) and the 5 min after (POST-stimulation) over the three OF sessions, left and right panels, respectively. Values are expressed as mean ± SEM (WT-YFP n = 10, WT-ChR2 n = 11, HD-YFP n = 13, and HD-ChR2 n = 11). Each point represents data from an individual mouse. Data were analyzed by two-way ANOVA with genotype and light stimulation as factors, and Bonferroni test as a post hoc. *p < 0.05, **p < 0.01, and ***p < 0.001.

Figure 4.

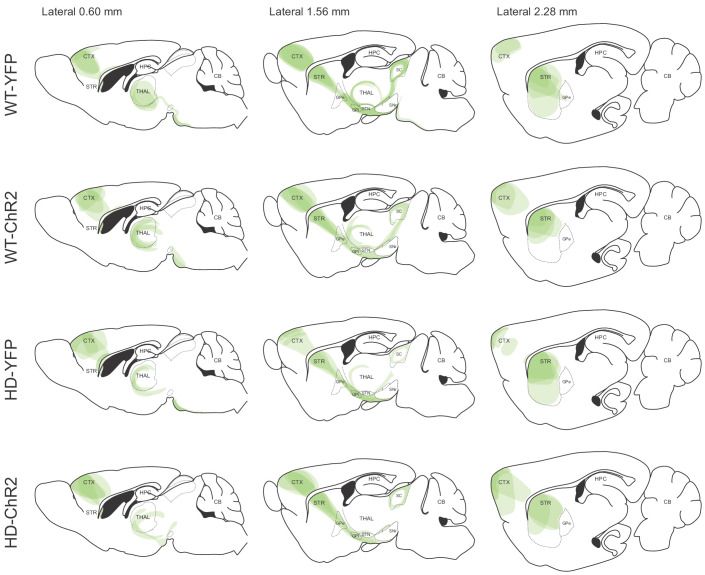
Figure 4—figure supplement 1. Validation of the AAV expression from the M2 cortex and its projections by YFP fluorescence.

Figure 4—figure supplement 1.

Overlay of the YFP expression from different mice was drawn over three representative sagittal sections: mediolateral coordinates 0.6, 1.56, and 2.28 mm obtained from the brain atlas (Franklin and Paxinos, 1997). For each of the animals studied, brain slices were analyzed, and the visualized virus-infected-pathways were plotted manually in the corresponding sagittal section. Each of the represented brain images contains different layers from four mice, each animal represented with a color opacity of 20%.
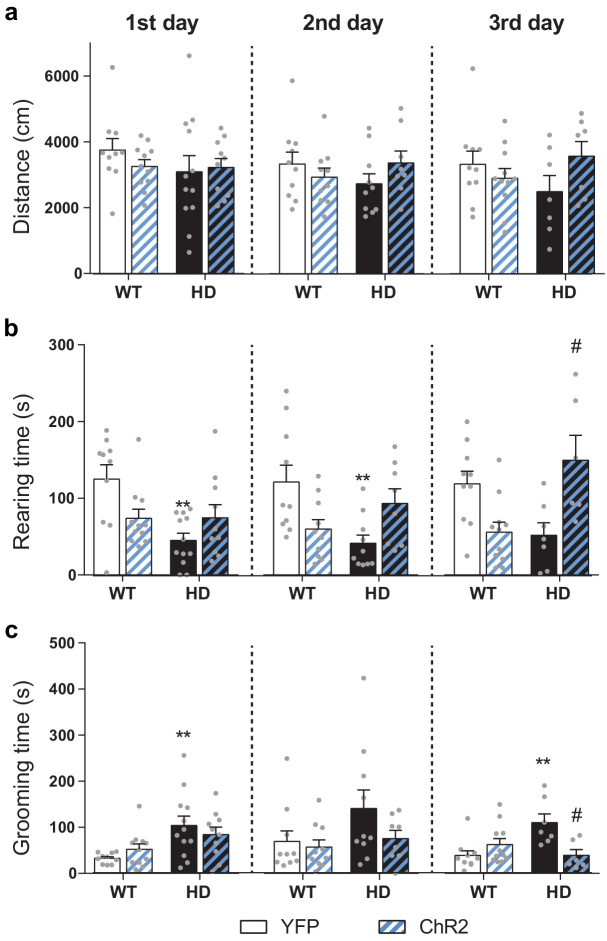
Figure 4—figure supplement 2. Average locomotion, exploration and stereotypies over the 11 min OF sessions.

Figure 4—figure supplement 2.

(a) Distance traveled (cm), (b) rearing time (s), and (c) stereotypic grooming time (s) were evaluated during the whole 11 min open field sessions. Values are expressed as mean ± SEM (WT-YFP n = 10, WT-ChR2 n = 11, HD-YFP n = 13, and HD-ChR2 n = 11). Distance traveled was similar between all groups in the different OF sessions. Two-way ANOVA test with genotype and stimulation as factors was performed and no significant effects were found. Rearing time was reduced in HD-YFP mice and optogenetic stimulation increased exploratory behavior over the sessions. Two-way ANOVA showed significant differences between groups (1st day: genotype F(1, 39)=7.540; p = 0.0091 and interaction effect F(1, 39)=7.889; p = 0.0077; 2nd day: Interaction effect F(1, 34)=11.56; p = 0.0017; 3rd day: Interaction effect F(1, 30)=17.90; p < 0.0004). Bonferroni post hoc analyses were performed and revealed significant differences between WT-YFP and HD-YFP during 1st and 2nd OF sessions and between HD-YFP and HD-ChR2 during the 3rd OF session. Stereotypic grooming was increased in HD-YFP mice and repeated optogenetic stimulation reduced stereotypic behavior in HD-CHR2 mice. Two-way ANOVA revealed significant differences between groups (1st day: genotype effect F(1, 39)=11.36; p = 0.0017; 3rd day: Interaction effect F(1, 30) = 11.42; p = 0.020). Bonferroni post hoc analyses revealed significant differences between WT-YFP and HD-YFP during the 1st and 3rd OF sessions and between HD-YFP and HD-ChR2 during the last OF session. **p < 0.01 versus WT-YFP and #p < 0.05 versus HD-YFP.
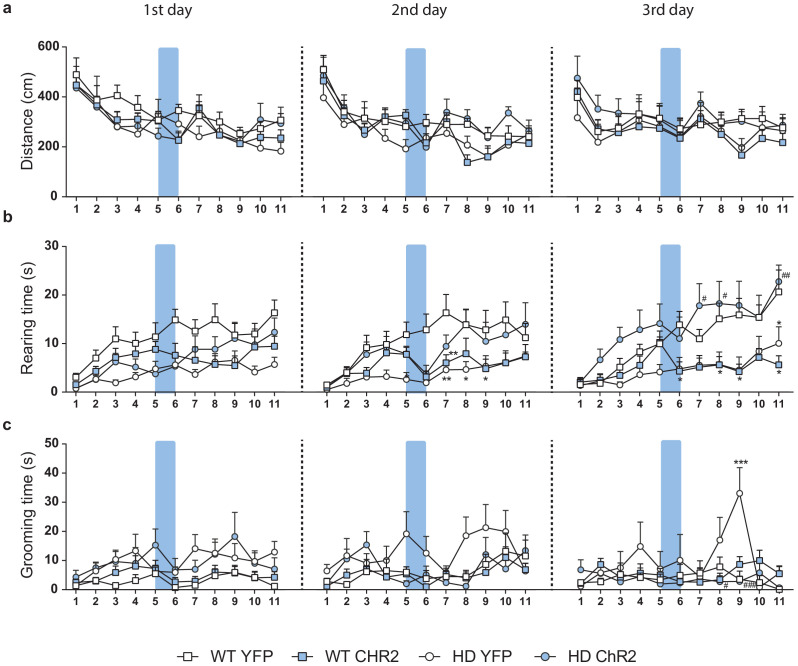
Figure 4—figure supplement 3. Representation of the changes in locomotion, exploration and stereotypies per minute during the whole 11 min OF sessions.

Figure 4—figure supplement 3.

(a) Distance traveled (cm), (b) rearing time (s), and (c) grooming time (s) per minute in 20-week-old WT-YFP, WT-ChR2, HD-YFP, and HD-ChR2 mice during the 1st (left), 2nd (middle), and 3rd (right) open field sessions. The blue box represents the duration of blue light stimulation (1 min). Repeated measures ANOVA with group and time as factors followed by Bonferroni’s post hoc comparisons test was performed. Bonferroni post hoc comparisons are shown when the interaction effect was found. Values are expressed as mean ± SEM (WT-YFP n = 10, WT-ChR2 n = 11, HD-YFP n = 13, and HD-ChR2 n = 11).