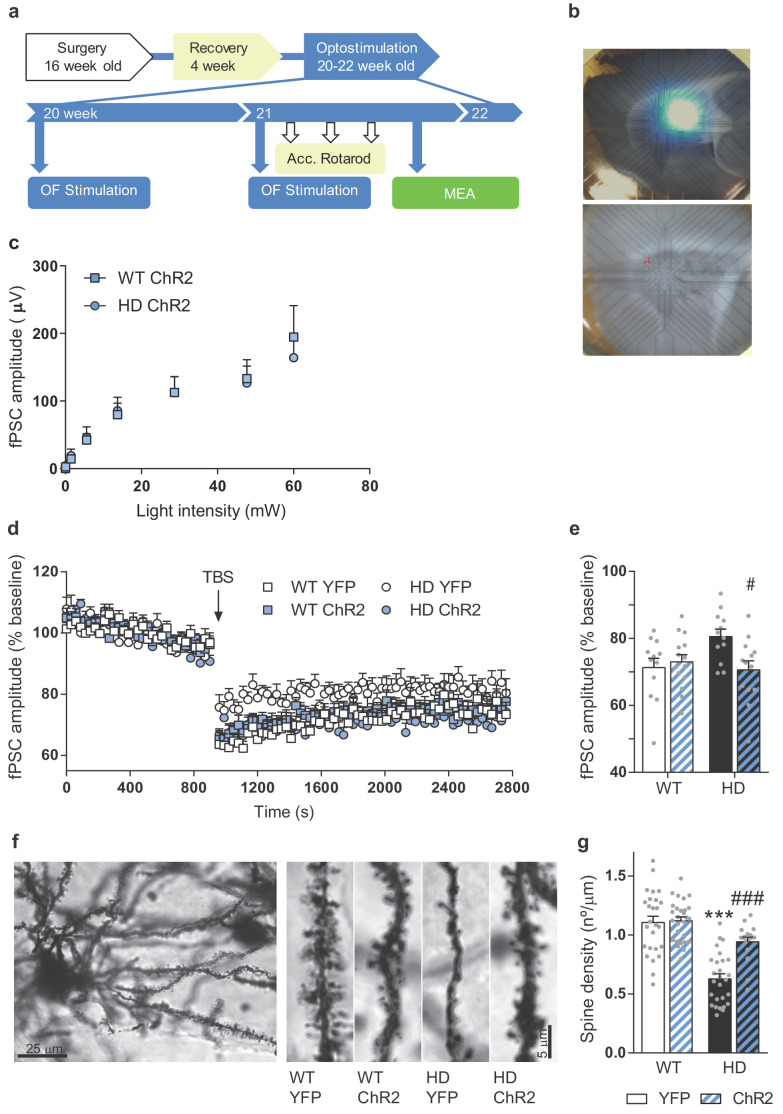
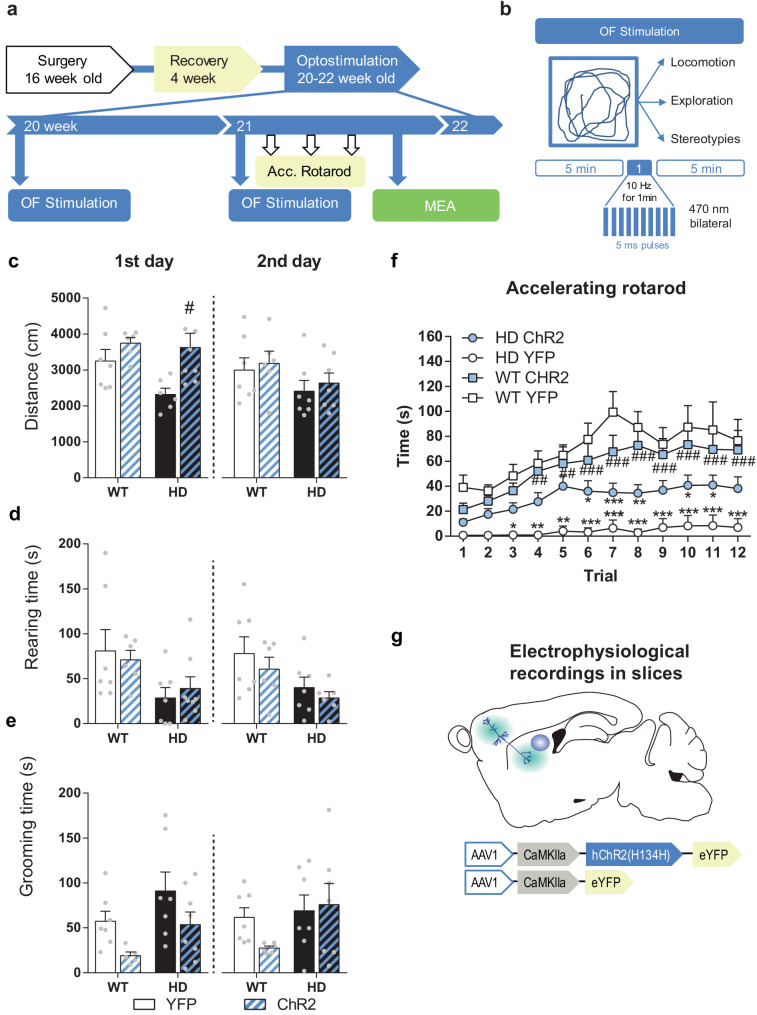
Figure 6. Repeated optogenetic cortico-striatal stimulation restores synaptic plasticity and dendritic spine density in HD mice.
(a) Surgery, behavior, and optogenetic experimental timeline. The electrophysiological evaluation was performed on the 3rd week in sagittal cortico-striatal slices. (b) A representative image showing the location of the light stimulation (top image) and stimulating electrodes (bottom image, highlighted in red). (c) Light intensity-induced striatal field postsynaptic currents in WT and HD mice with AAV-ChR2 expressed in M2 cortex. (d) The graph shows the time course of LTD evoked at cortico-striatal synapses following a TBS. The TBS, indicated by the arrow, was presented after 15 min of baseline recordings. Field postsynaptic currents (fPSC) are represented as a percentage of baseline. (e) The histogram shows the averaged amplitude of fPSC evoked during 30 min after TBS. Data were analyzed by repeated-measures ANOVA with genotype and stimulation as factors and Bonferroni’s multiple comparison as post hoc test. Values are expressed as mean ± SEM (WT-YFP n = 12, WT-ChR2 n = 13, HD-YFP n = 12, and HD-ChR2 n = 14 mice). (f) Golgi-impregnated representative neuron and segments of secondary dendrites from MSNs from WT and HD mice infected with AAV-YFP and AAV-ChR2, respectively. Scale bar, 3 μm. Dendritic spines were counted in a segment of known length (~20 μm) to obtain the spine density. (g) Quantitative analysis of spine densities per μm of the dendritic length of 3–13 neurons per mice. HD-YFP mice exhibit a significant reduction in dendritic spines that was significantly increased in stimulated HD-ChR2. Two-way ANOVA with Bonferroni’s post hoc comparisons test was performed. All data are shown as the mean ± SEM. ***p < 0.001 versus WT-YFP and #p < 0.05 and ###p < 0.001 versus HD-YFP.


