. 2020 Jul 16;9:e45530. doi: 10.7554/eLife.45530

Figure 5. Evolution of the Nodal signaling pathway.

Two consensus phylogenetic trees showing the relationship of major metazoan lineages. The five factors of the Nodal signalling pathway (Nodal, Lefty, EGF-CFC, FoxH1, and Eomes) are displayed as coloured boxes. Their phylogenetic distribution and inferred evolutionary origin are mapped onto the tree. Gene births are indicated as coloured boxes above the respective branch. Inferred losses are represented by crosses. Bold labels to the left of a branch indicate branch ancestors: B = Bilateria, Eu = Eumetazoa, M = Metazoa. (A) Previous results regarding the evolution of Nodal pathway genes, as known from the literature. (B) Revised evolutionary history of the Nodal pathway genes according to our results. Note that none of the five factors has been found in arthropods and nematodes. The ecdysozoan boxes for Eomes and FoxH1 are derived from the presence of the genes in a single priapulid species. Grey shading: Hypothetical emergence of a putative kernel for mesoderm specification and neural patterning.

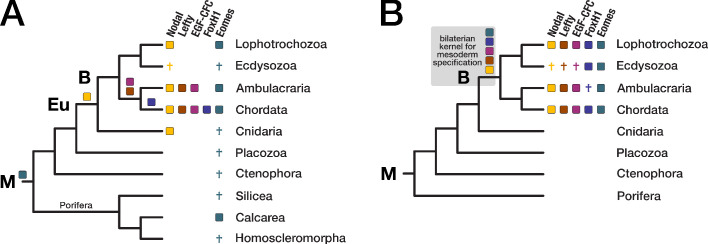
Figure 5.

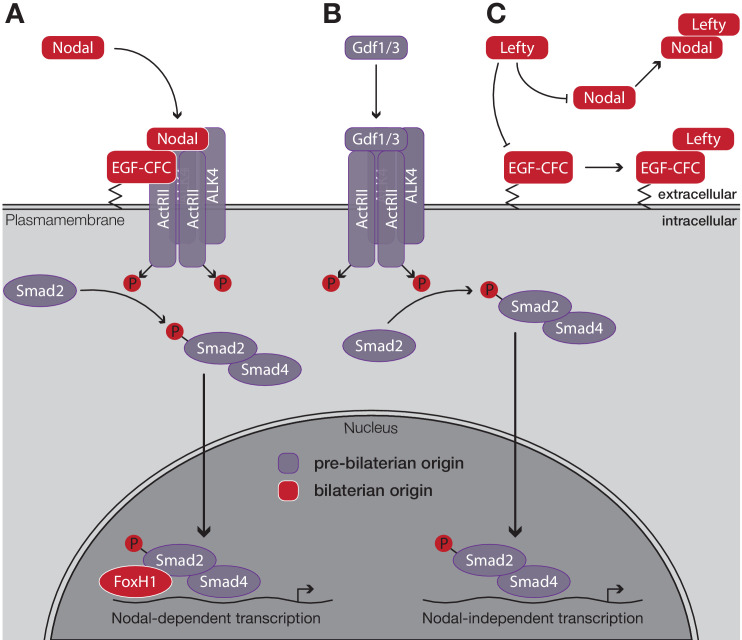
Figure 5—figure supplement 1. Schematic outline of the Nodal signaling pathway in vertebrates.

Figure 5—figure supplement 1.

(A) Nodal binds to its cell surface receptor in the presence of the co-receptor EGF-CFC, activating the resulting complex. After phosphorylation, the Smad2/Smad4 complex translocates to the nucleus. Upon binding of the transcription factor FoxH1, transcription of Nodal target genes is initiated. (B) Nodal-independent transcription via the same pathway does not require the co-receptor EGF-CFC or the transcription factor FoxH1. (C) Lefty antagonises Nodal function by blocking either its co-receptor, EGF-CFC, or by directly binding to Nodal. Factors that evolved in the ancestor of bilaterians are displayed in red, all other factors evolved in the ancestor of eumetazoans or earlier. Figure modified after Shen, 2007.
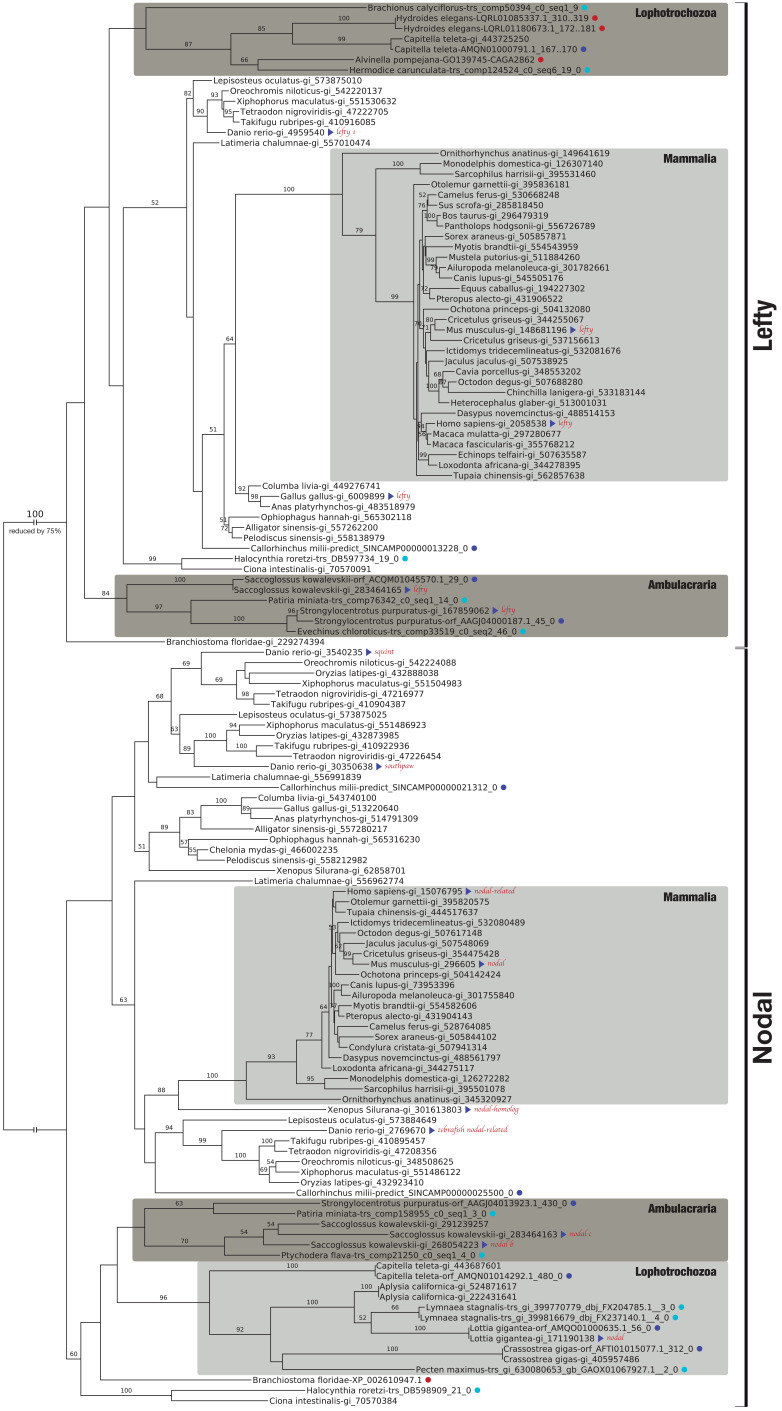
Figure 5—figure supplement 2. Bilaterian-specific distribution of the Nodal pathway components Nodal and Lefty.

Figure 5—figure supplement 2.

Maximum likelihood phylogeny of selected bilaterian Lefty and Nodal proteins. The corresponding multiple sequence alignment consists of 24 sequences with 446 columns and 29.01% gaps and undetermined characters. The sequences correspond to OG_11821 (Lefty) and OG_12210 (Nodal) of the original clustering plus several additional candidate sequences from public repositories (red dots). Blue dots highlight whether a sequence is derived from transcriptomic (light blue) or genomic ORF data (dark blue). All other sequences can be accessed at NCBI with the gene identifiers given as branch labels. Blue triangles identify previously described Lefty and Nodal reference sequences. Bootstrap values below 50% are removed for clarity. There are three Nodal-related genes in teleosts, cyclops, squint, and southpaw, as a result of lineage-specific duplications (Fan and Dougan, 2007).
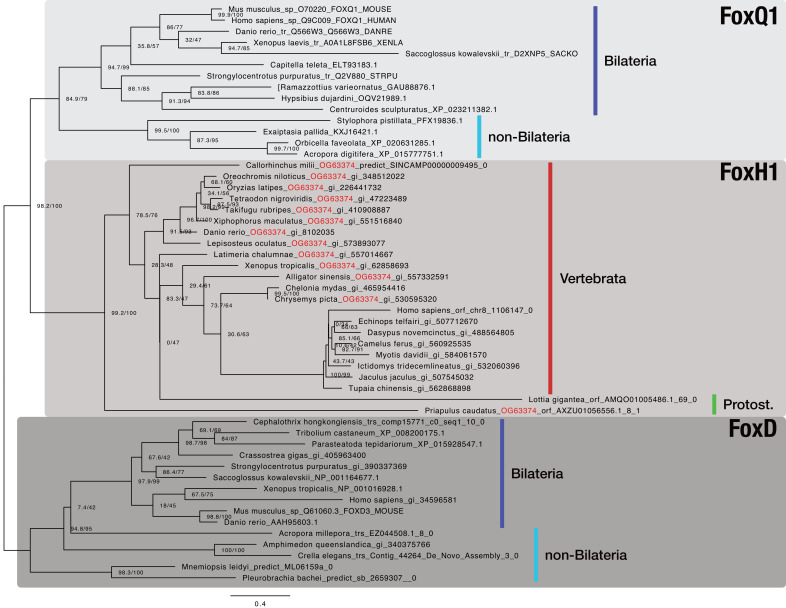
Figure 5—figure supplement 3. Bilaterian-specific distribution of the Nodal pathway component FoxH1.

Figure 5—figure supplement 3.

Maximum likelihood phylogeny of selected metazoan Fox genes. The multiple sequence alignment consists of 52 sequences aligned over 315 positions (proportion of gaps and undetermined characters: 25.07%). It is generated from OG_36001 (FoxH1), OG_63374 (RBH with OG_36001; orthogroup ID labeled in red), and representative sequences of OG_3972 (FoxD4 as outgroup; third-best hit of OG_36001 in HMM-HMM searches, see Supplementary file 1–Supplementary Table 14) of the original clustering. Selected FoxQ1 proteins were used as outgroup as FoxQ1 resembled the closest relative of FoxH1 proteins in other studies (Yu et al., 2008; Fritzenwanker et al., 2014). Vertebrate and protostomian FoxH1 sequences are decorated with a red and green bar, respectively. Sequences derived from genomic and transcriptomic ORFs are labelled with "|orf_", "|trs_", or "|predict_". All other sequences can be accessed at NCBI with the given identifiers. Branch labels correspond to the results of SH-aLRT (Shimodaira–Hasegawa-like approximate likelihood ratio test, left) and UFBoot (ultrafast bootstrap approximation, right) as implemented in IQ-TREE (Nguyen et al., 2015).
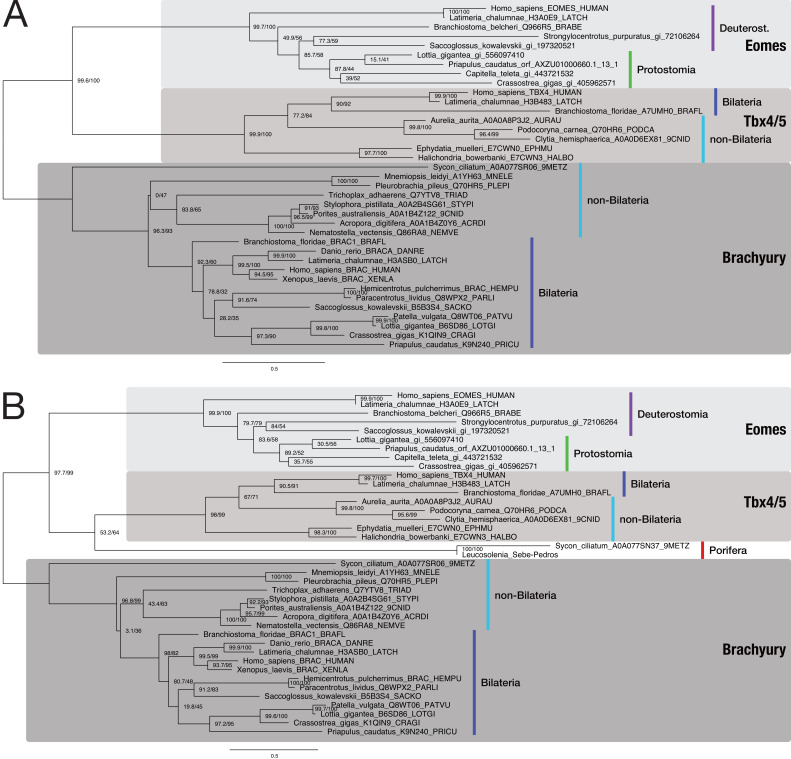
Figure 5—figure supplement 4. Bilaterian-specific distribution of the Nodal pathway component Eomesodermin.

Figure 5—figure supplement 4.

(A) Maximum likelihood phylogeny of selected poriferan and bilaterian Eomesodermin sequences. The multiple sequence alignment consists of 37 sequences aligned over 434 positions (proportion of gaps and undetermined characters: 22.80%). Sequences were downloaded from uniprot.org or taken from NCBI (gi_*). TBX4 and Brachyury sequences serve as outgroups because they are most closely related to the Eomes family according to Sebé-Pedrós et al., 2013 and HMM-HMM searches (Supplementary file 1–Supplementary Table 14). A phylogenetic analysis with an identical dataset, including the two poriferan Eomes candidates (highlighted in red; from Sebé-Pedrós et al., 2013), is presented in panel B (39 sequences aligned over 435 positions; proportion of gaps and undetermined characters: 23.64%). Branch labels correspond to the results of SH-aLRT (Shimodaira–Hasegawa-like approximate likelihood ratio test, left) and UFBoot (ultrafast bootstrap approximation, right) as implemented in IQ-TREE (Nguyen et al., 2015). Tree topology and corresponding bootstrap values do not clearly assign the poriferan sequences to the Eomes family of T box proteins.