. 2020 Jul 16;9:e45530. doi: 10.7554/eLife.45530

Figure 7. The bilaterian-wide distribution of neurotrophic factors.

The NTRK receptor and 14 major neurotrophic factors are displayed as coloured boxes. Their phylogenetic distribution and inferred evolutionary origin are mapped onto the tree (see Supplementary file 1–Supplementary Table 22 and Supplementary file 1–Supplementary Table 23). Gene births are indicated as coloured boxes above the respective branch of the tree (left). Inferred losses are shown as coloured crosses in the matrix. Bold labels to the left of a branch indicate branch ancestors: Ac = Actinopterygii, B = Bilateria, Ch = Chordata, Eu = Eumetazoa, Gn = Gnathostomata, M = Metazoa, Sa = Sarcopterygii. The neurotrophic factors of Cladistia, the sister group of Actinopteri, are inferred and distinguished by a question mark as the dataset lacks species from this lineage.

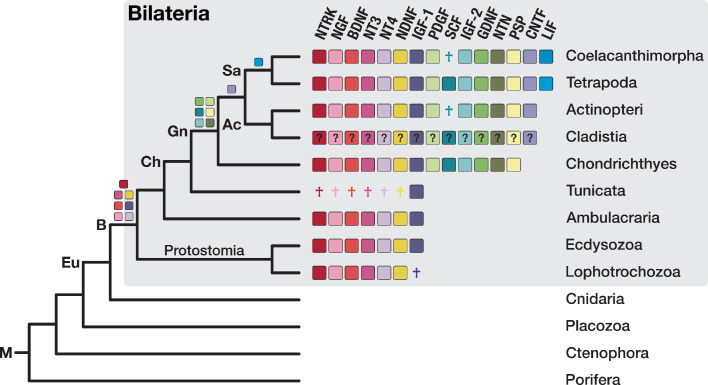
Figure 7.

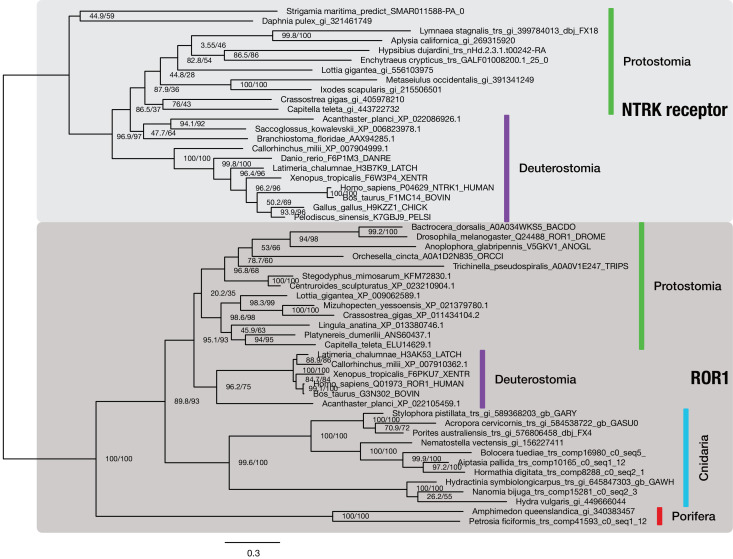
Figure 7—figure supplement 1. The NTRK neurotrophin receptor is restricted to bilaterians.

Figure 7—figure supplement 1.

Maximum likelihood phylogenetic analysis of 53 metazoan NTRK and ROR1 sequences (outgroup), aligned over 602 AA. Proportion of gaps and completely undetermined characters in the corresponding alignment: 16.84%. Sequences were collected from different sources: NTRK receptor sequences from protostomes are derived from OG_8965–1.4 of the 1.4 clustering, an orthogroup containing RTKs only (Supplementary file 1–Supplementary Table 24). Deuterostomian NTRK sequences were collected at www.uniprot.org. Non-bilaterian ROR1 sequences were obtained from OG_6493–1.4, the ROR1-specific orthogroup of the 1.4 clustering (Supplementary file 1–Supplementary Table 24), while most bilaterian ROR1 sequences were downloaded from www.uniprot.org. Branch labels correspond to the results of SH-aLRT (Shimodaira–Hasegawa-like approximate likelihood ratio test, left) and UFBoot (ultrafast bootstrap approximation, right) as implemented in IQ-TREE (Nguyen et al., 2015).