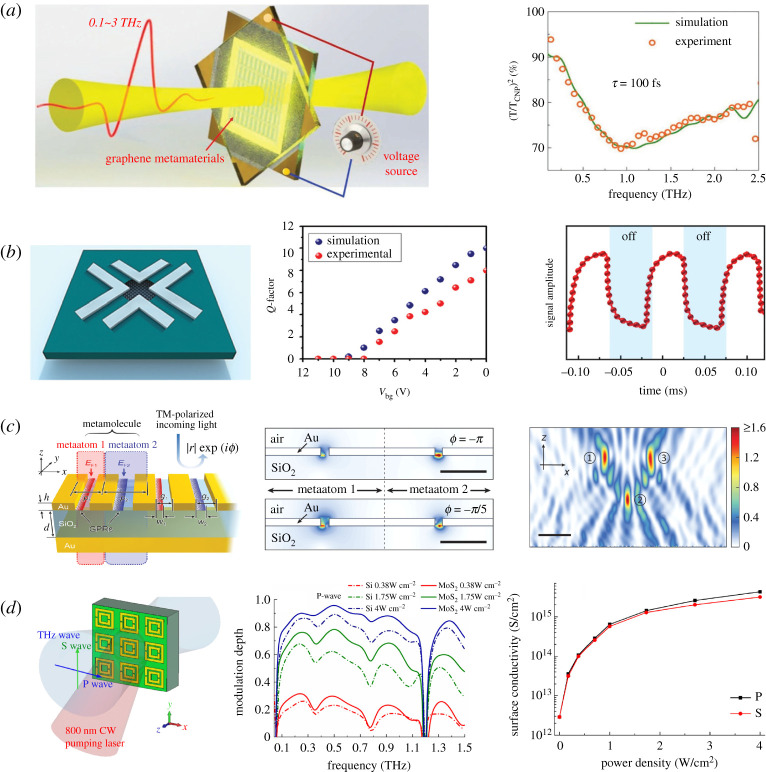
Figure 5.
(a) Schematic of the device, and set-up of the experimental measurement; SEM image of the SRR structure; experimental and fitted transmission spectra with a relaxation time of 100 fs [81]. (b) Schematic of graphene island-mediated cluster structure; Q value and response optical signal in the experiment [82]. (c) Schematic of the proposed graphene plasmonic metamolecule; electric field distribution around the structure with a fixed amplitude; magnetic distribution with the beam spot triple focused to the specified location [120]. (d) Schematic of the MoS2 metasurface; modulation depth in the metasurface and photoconductivity measured in the experiment [121]. (Online version in colour.)

