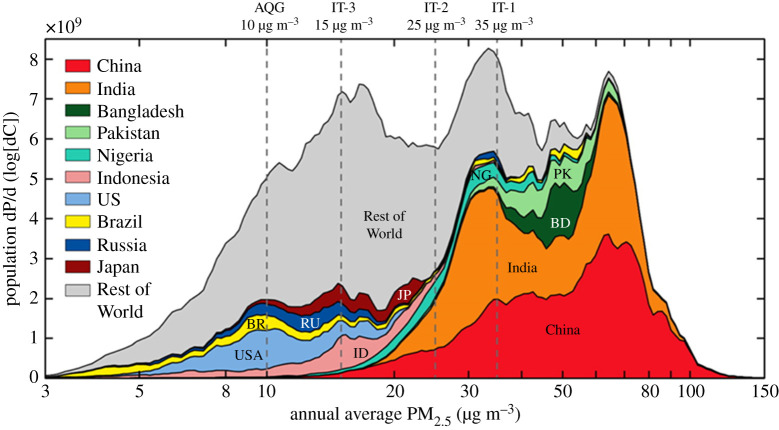
Figure 5.
Distributions of the population as a function of annual (2013) average ambient PM2.5 concentration for the world's 10 most populous countries and the rest of the world. Dashed vertical lines indicate World Health Organization Interim Targets (IT) and the Air Quality Guideline (AQG). Source: Brauer et al. [107]. (Online version in colour.)

