
Figure 2.
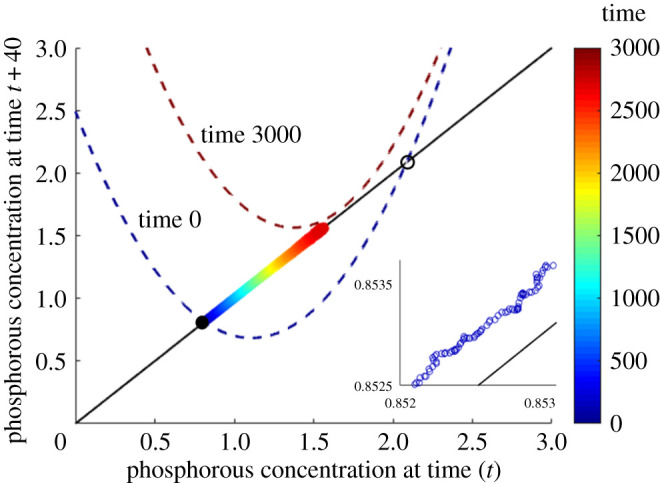
Snapshots of the fitted time-delay map from the lake phosphorous time series with delay τ = 40, taken at times t = 0 (dark blue dashed curve) and t = 3000 (dark red dashed curve). Time-series data points before the transition are shown coloured according to the corresponding time t, with a close-up of these data points shown in the inset. The stable (filled black circle) and unstable (open black circle) equilibria of the map at t = 0 are also shown.