
Figure 5.
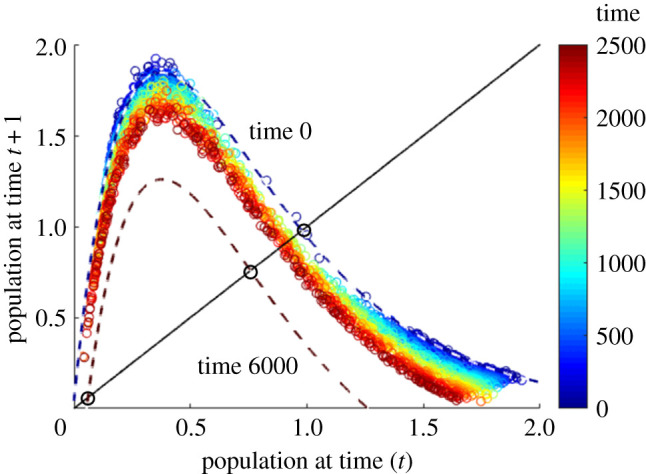
Simulated data points from the fishery model time series, coloured according to the time at which they are observed, plotted with snapshots of the time-dependent Ricker map fitted to the calibration window t ∈ [0, 1250] taken at t = 0 (dark blue dashed curve) and t = 6000 (dark red dashed curve).