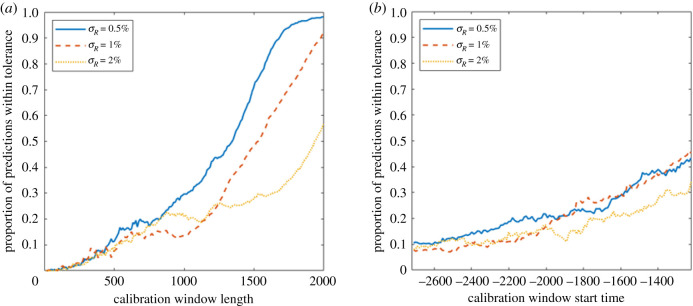
Figure 8.
The dependence of the reliability of the predictions on the length and start time of the window of calibration data for different noise levels σR in the lake phosphorous system. The proportion of predicted times of total resilience loss which are within 500 time points of the actual transition time tc (a) given a fixed length t2 − t1 of the calibration window and averaged over start times t1 − tc for t1 ∈ [0, 600] (b) given a fixed start time t1 − tc and averaged over window lengths t2 − t1 ∈ [0, 1100]. Each set of results is averaged over 10 independent realizations of the system.

