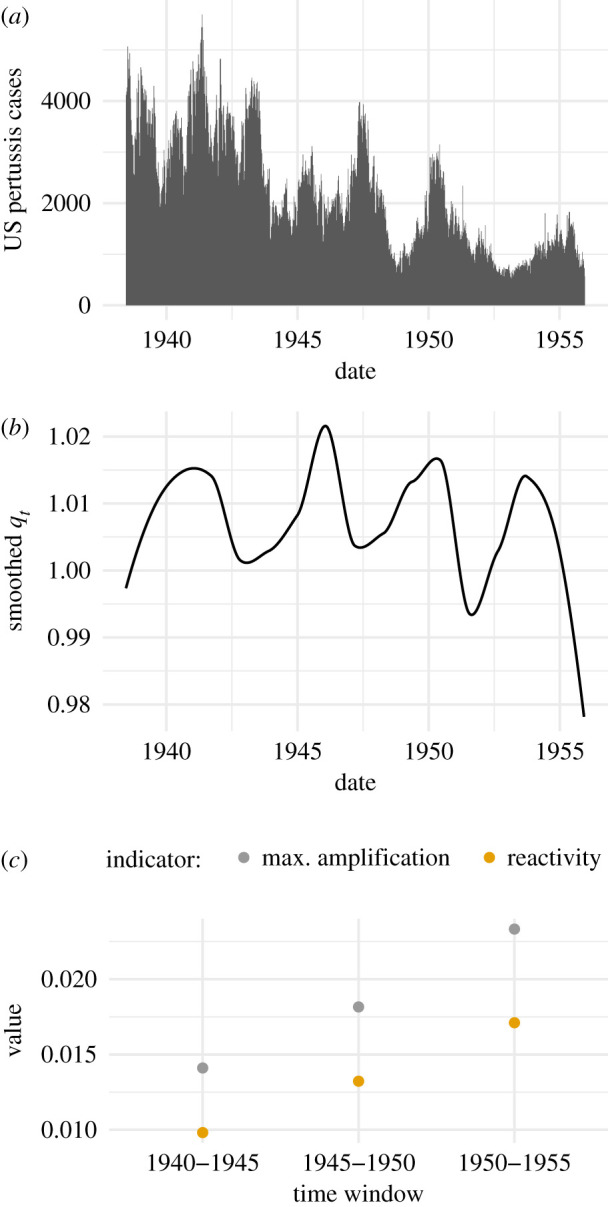
Figure 2.

Transient indicators calculated from historical pertussis case reports increased over the period 1940–1955. (a) National level weekly total of pertussis case notifications for most states in the United States. (b) Estimated smoother of qt (2.12). This smoother is proportional to the number of susceptibles, which our transient indicators target. (c) Both transient indicators increase in each successive 5-year window, which may be a consequence of increasing use of an effective vaccine.
