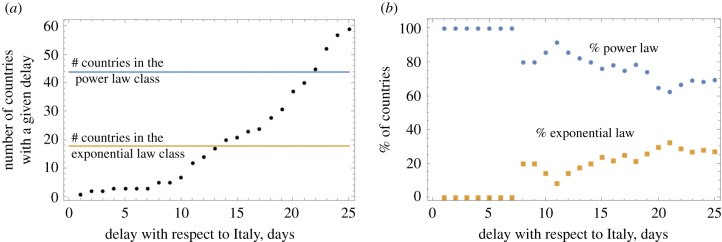
Figure 7.
Temporal development of infection. The ‘age’ of the epidemic is measured by the days of delay with respect to Italy. (a) The number of countries for each value of the time-lag with respect to Italy. The number of countries in the two growth law classes is shown for comparison. (b) The percentage of countries with a given delay that belong to the power law group and to the exponential law group. The trend that the percentage of exponential growth increases with the time lag (that is, decreases with the epidemic ‘age’) is significant (p < 10−4 by linear fitting).

