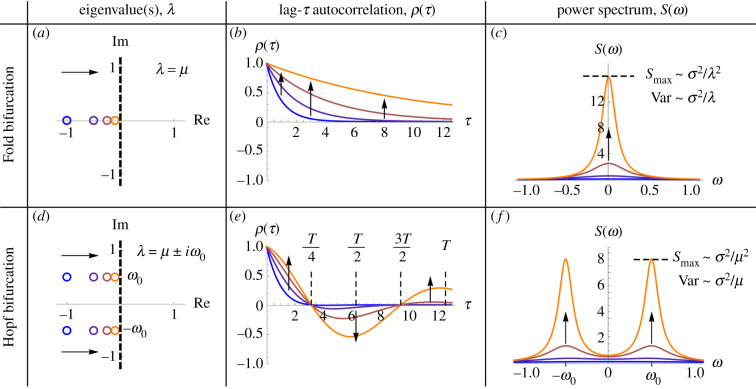
Figure 1.
Contrasting analytical EWS preceding the Fold and the Hopf bifurcation. Analytical approximations for the autocorrelation function and power spectrum (table 1) are plotted at various distances to the bifurcation given by μ = { − 1, − 0.5, − 0.25, − 0.1}, where μ is the real part of the system’s dominant eigenvalue. (a) The Fold bifurcation involves a single real eigenvalue becoming positive. (b) Autocorrelation increases at all lag times, though very small lag times give a less noticeable increase, and large lag times yield a delayed increase. (c) The power spectrum becomes dominated by lower frequencies, with a peak amplitude that increases asymptotically faster than the variance (as μ → 0). (d) A Hopf bifurcation involves a complex-conjugate pair of eigenvalues obtaining positive real part. The imaginary part of the eigenvalues (ω0) corresponds to the frequency of oscillations that occur at the bifurcation. (e) The trend of autocorrelation depends on how the lag time compares with the underlying period of oscillations (T = 2π/ω0). For lag times near to half the period of oscillations, one in fact observes decreasing autocorrelation. (f) The power spectrum becomes dominated by ω0, with the peak amplitude increasing favourably compared to variance. Parameter values are ω0 = 0.5, σ = 1. Similar figures for each type of local codimension-1 bifurcation are provided in electronic supplementary material, figure S1.

