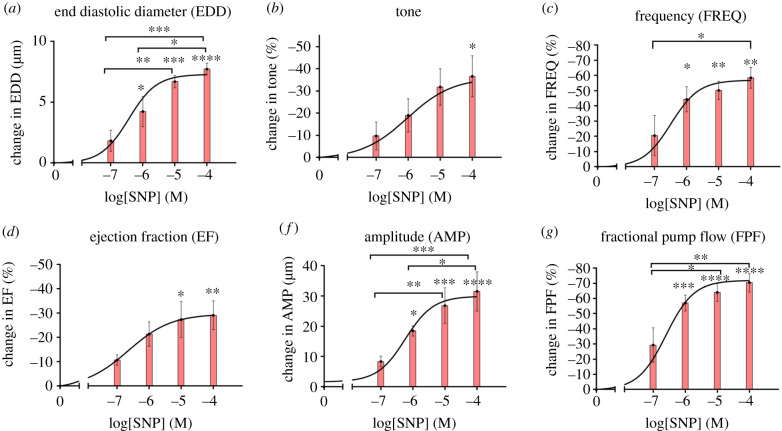
Figure 5.
Per cent change in contractile metrics (from figure 4) in response to different SNP doses including per cent change in end-diastolic diameter (AMP; a), per cent change in basal tone (tone; b), per cent change in frequency of contractions (FREQ; c), per cent change in amplitude of contractions (AMP; d) per cent change in ejection fraction (EF; e), per cent change in fractional pump flow (FPF; f). All data are presented as mean ± s.e.m. (n = 4) and statistical significance was tested via ANOVA and Tukey's post hoc tests (*p < 0.05, **p < 0.005, etc.). The statistical significances were tested to compare changes with respect to control values (zero SNP dose) as well as multiple comparisons between different doses.

