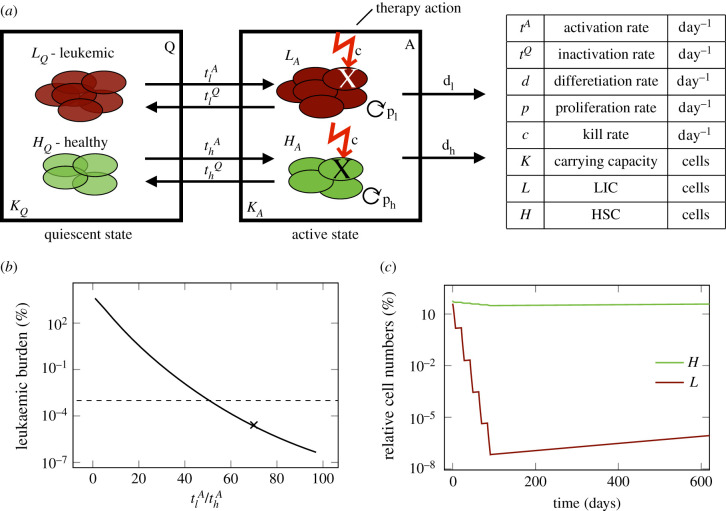
Figure 1.
(a) Schematic overview of the mathematical model describing the dynamics of leukaemia-initiating cells (LIC), L and healthy stem cells (HSC), H in the bone marrow of an AML patient. (b) Leukemic burden after therapy depending on the ratio of leukaemic activation to healthy activation . Dashed line shows detection limit for clinically measured leukaemic burden. For x the time course is shown in figure 1c. (c) Time course of leukaemic and healthy cell numbers relative to the numbers at diagnosis with a .

