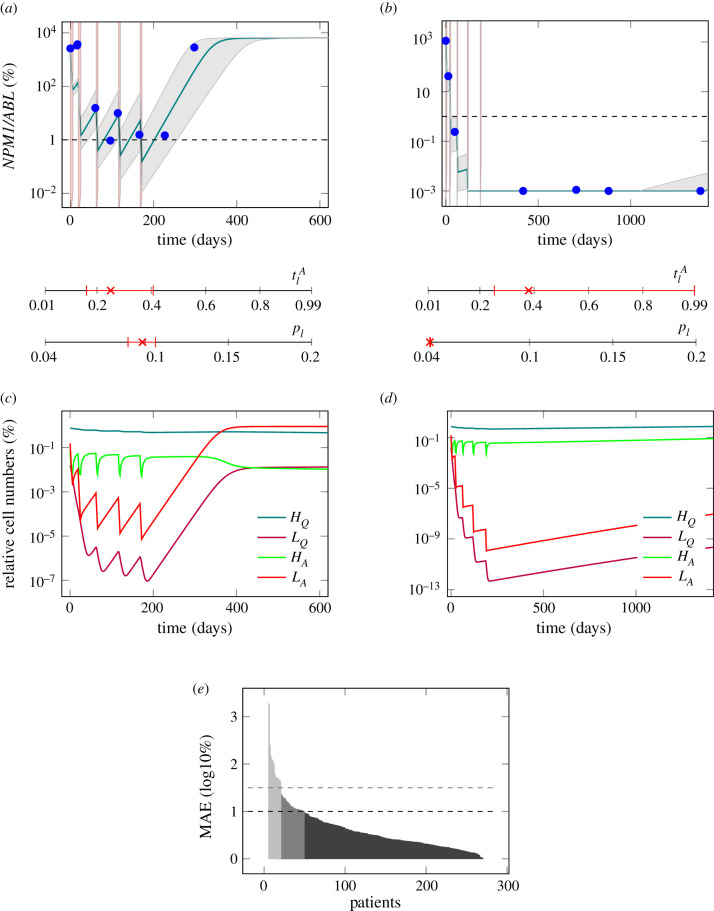
Figure 2.
(a) Model fit to the data (PatientID = 104) and 95% confidence interval (CI) of an example patient suffering a relapse. . (b) Model fit to the data (PatientID = 3137) and 95% CI of an example patient staying in long time remission. . The red shaded regions are the times of treatment. The red marks indicate the fitted parameter values for the leukaemic activation () and the leukaemic proliferation (pl) with their corresponding 95% CI. (c) Time courses of cell numbers relative to the total cell numbers at diagnosis of model fit to patient from plot (a). (d) Time courses of cell numbers relative to the total cell numbers at diagnosis of model fit to patient from plot (b). HQ, quiescent HSCs, LQ, quiescent leukaemic stem cells (LSCs), HA, active HSCs, LA, active LSCs. (e) MAE in log10% for all patient fits as a measure of goodness of fit. Black dashed line indicates threshold for quantitatively good fitting patients. Grey dashed line indicates threshold for qualitatively good fitting patients. For all patients with higher MAE the fit was poor.

