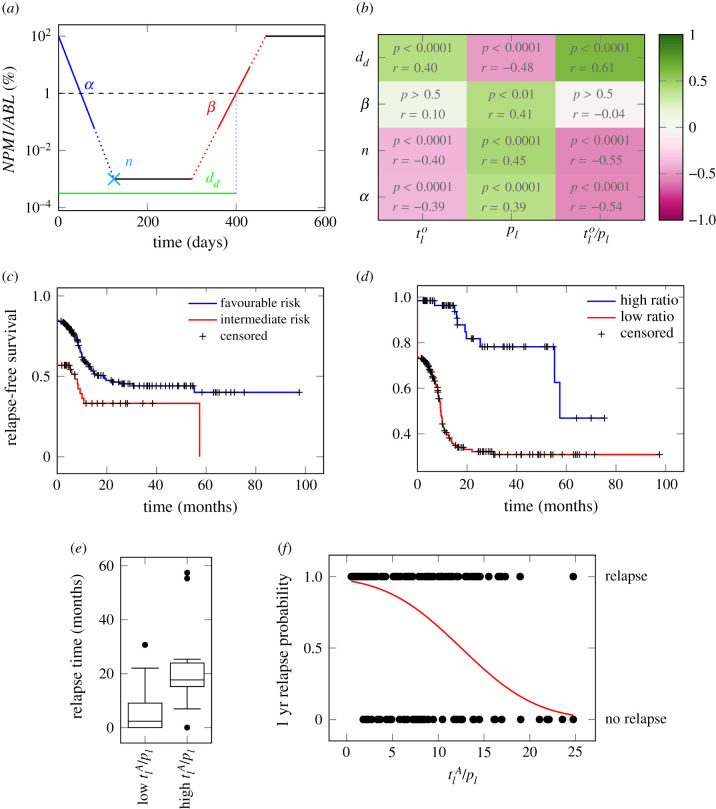
Figure 3.
(a) Schematic overview of an NPM1 time course. α: elimination slope during primary therapy [log10% d−1]; n: minimal NPM1 level after primary treatment within nine months after treatment start [log10%]; β: the maximum slope during relapse phase [log10% d−1]; d: time until molecular relapse [days]. (b) Spearman correlation coefficients between the fitted parameters (i.e. leukaemic activation , leukaemic proliferation pl and their ratio) and the patients molecular time course characteristics with adjusted p-values. (c) Relapse-free survival for intermediate and favourable ELN risk groups. p < 0.01 (logrank-test). HR = 1.86. (d) Relapse-free survival for high and low ratio of leukaemic activation and leukaemic proliferation () as estimated by the mathematical model with a threshold between high and low of 18. p < 0.0001 (logrank-test). HR = 5.47. (e) Boxplot for the comparison of the molecular relapse times of patients with high (n = 116) or low (n = 10) ratio of leukaemic activation and leukaemic proliferation () as estimated by the mathematical model with a threshold between high and low of 18. p < 0.0001 (U-test). (f) One year relapse probability (sigmoid function) as estimated by a logistic regression. Corresponding patient data (•) indicate the 1 year relapse status (relapse/no relapse) depending on the ratio of the two fitted parameters ().

