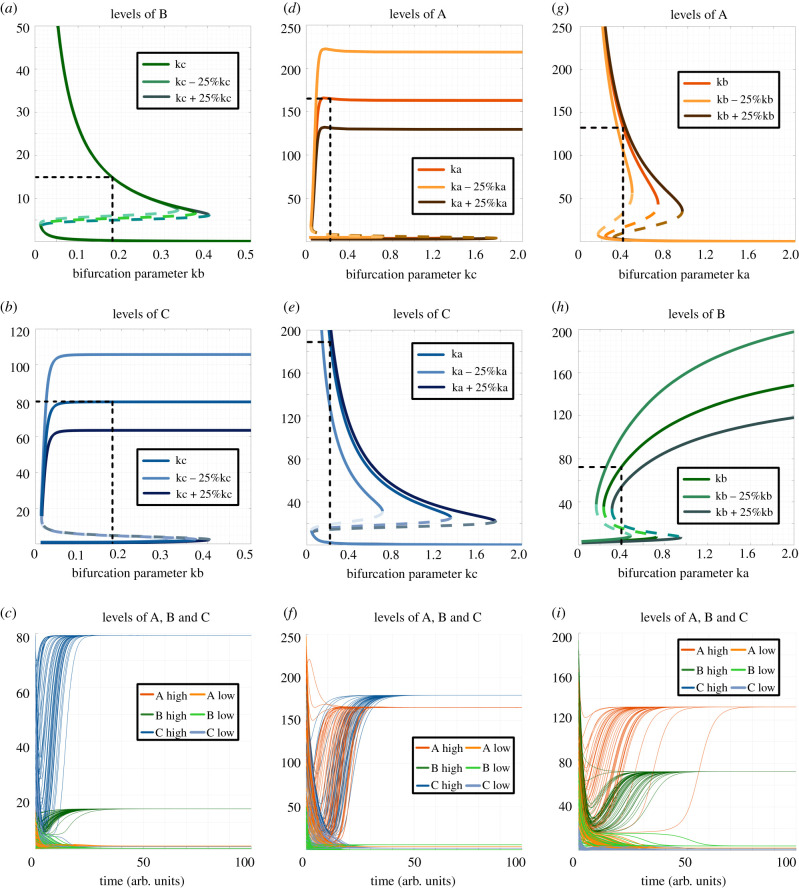
Figure 4.
Bifurcation diagrams and dynamics plots for representative cases of bistable phases. (a) Bifurcation diagram of expression level of component B with kb as bifurcation parameter for the bistable phase {aBc, abC}. (b) The same as (a) but for component C. (c) Dynamics plots of expression levels of components A, B and C for the bistable phase {aBc, abC}, showing convergence to two different states with varied levels of B and C (levels of A are low in both cases). (d) Bifurcation diagram of the expression level of component A with kc as bifurcation parameter for the bistable phase {Abc, abC}. (e) Same as (d) but for component C. (f) Dynamics plots of expression levels of components A, B and C for bistable phase {Abc, abC}, showing convergence to two different states with varied levels of A and C (levels of B are low in both cases). (g) Bifurcation diagram of expression level of component A with ka as bifurcation parameter for the bistable phase {aBc, Abc}. (h) Same as (g) but for component B. (i) Dynamics plots of expression levels of components A, B and C for the bistable phase {aBc, Abc}, showing convergence to two different states with varied levels of A and B (levels of C are low in both cases). Parameter values for columns A–C, D–F and G–I are given correspondingly in electronic supplementary material, table S13. The bifurcation diagrams for ‘low' components (component A in (a–c), component B in (d–f), component C in (g–i)) are shown in electronic supplementary material, figure S11.

