Figure 8.
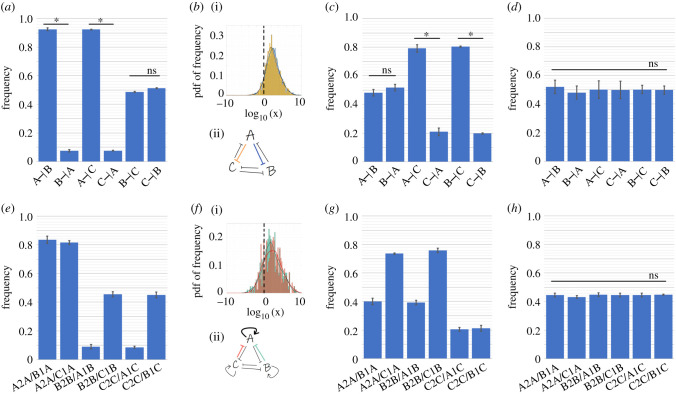
Design principles of toggle triad (TT) and that with self-activation (TT + 3SA). (a) Frequency of dominance of six inhibitory links for the case of monostable (A high, B low, C low) (i.e. {Abc}) in TT. X –|Y denotes the frequency of parameter sets when the inhibition of X on Y was stronger than the that of Y on X; thus adjacent two columns total up to 1. (b) (i) Probability distribution functions of histograms of frequency of values of x(A–|B)/x(B–|A) (blue) and values of x(A–|C)/x(C–|A) (yellow) in TT for monostable case {Abc}. The x-axis is log10 transformed and the dotted line represents the numerical value 1. (ii) Schematic showing that A inhibiting B and C are stronger links than B and C inhibiting A overall for parameter sets corresponding to monostable {A} (c) Same as (a) but for bistable (i.e. {Abc, aBc}) in TT. (d) Same as (a) but for tristable case {Abc, aBc, abC} in TT. (e) Frequency of parameter cases for which self-activation dominates upon incoming inhibitory link, for monostable case {Abc} in TT + 3SA. X2X/X1Y denotes the percentage of parameter sets for which X self-activation is stronger than Y inhibiting X. (f) (i) Probability distribution functions of histogram of frequency of x(A2A)/x(B1A) and x(A2A)/x(C1A) in TT + 3SA. The x-axis is log10 transformed and the dotted line represents the numerical value of 1. (ii) Schematic showing that for most of the parameter sets corresponding to {Abc}, self-activation of A dominates inhibition of A by B or C. (g) Same as (e) but for bistable case {Abc, aBc} in TT + 3SA. (h) Same as (e) but for tristable case {Abc, aBc, abC} in TT + 3SA. * denotes statistical significance (p < 0.01 for Student’s t-test). ‘ns' denotes statistically non-significant cases. Parameters corresponding to figure 8, electronic supplementary material figure S16 are given in tables S14, S15.

