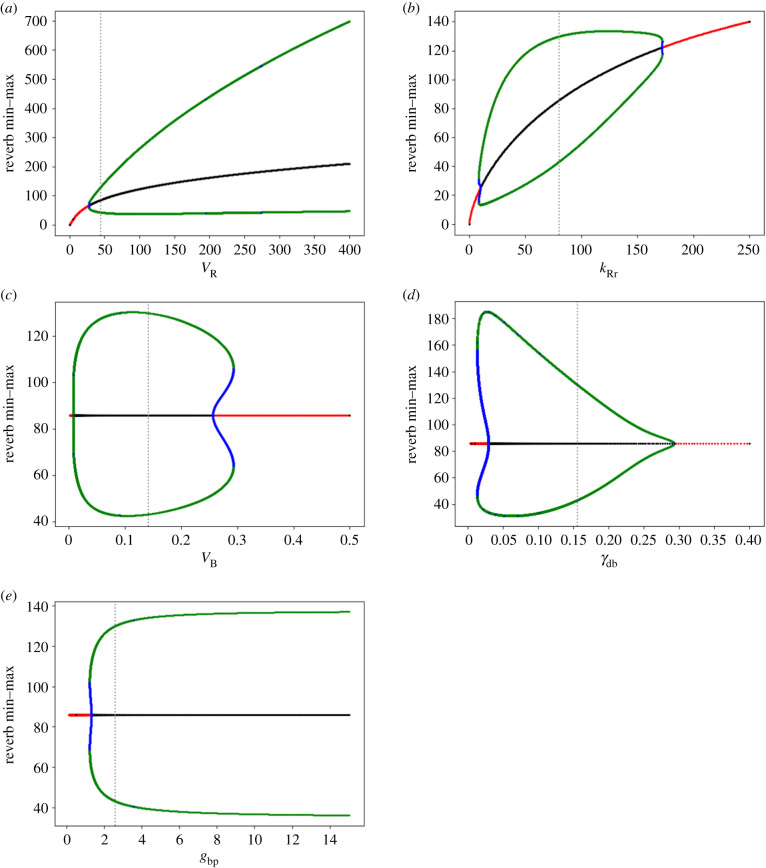
Figure 12.
Bifurcation diagrams as a function of the four ODE model parameters VR (a), kRr (b), VB (c), γdb (d) and γbp (e). Grey dashed lines indicate default parameters. The plots show stable steady state (red), unstable steady state (black), stable limit cycle (green) and unstable limit cycle (blue).

