Figure 4.
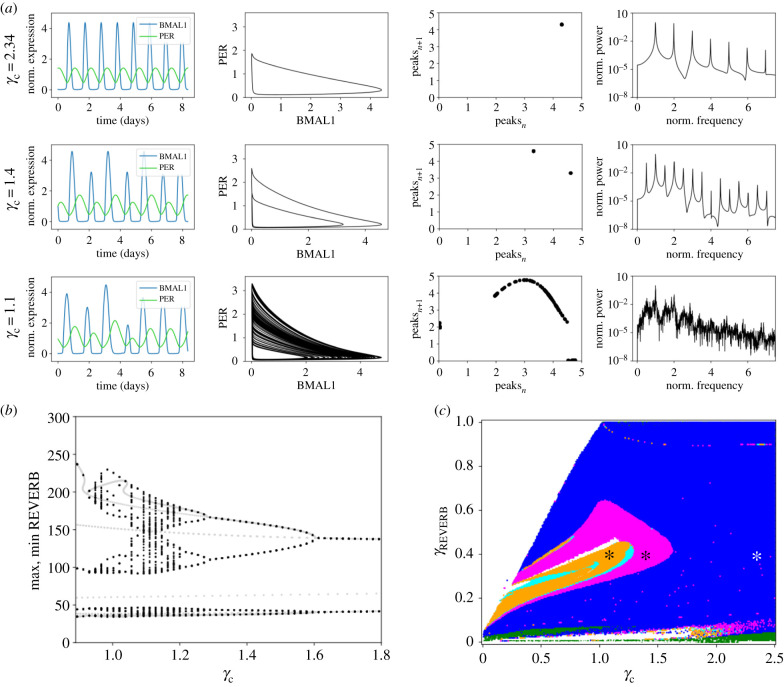
Bifurcation analyses reveal period-doubling and chaos in the eight ODE model. (a) Variations in γc reveal nonlinear phenomena: limit cycle (top, γc = 2.34 h−1), period-doubling (middle, γc = 1.4 h−1), and chaos (bottom, γc = 1.1 h−1) shown as time series, phase portraits, return maps and power spectra (from left to right, respectively). Parabola-shaped return maps are a feature of chaotic dynamics. The period in the power spectra is normalized to the period with maximum power. Note that chaotic oscillations were not normalized to obtain a 24 h peak-to-peak distance. Time series are normalized to their means. (b) Bifurcation diagram as a function of parameter γc. Black dots represent the results of the brute force simulation, in which period-doubling cascades and chaos can be observed. Grey dots represent the results of the bifurcation analysis using continuation software. Note that absolute values of the simulated concentration of REVERB are shown here, instead of normalized values to the mean. (c) Two-dimensional bifurcation diagram as a function of parameters γc and γREV reveals nonlinear phenomena: period-doubling (magenta), period quadrupling (cyan) and chaos (orange). Limit cycle is depicted in blue, stable steady state in green and white represents numerical instabilities. Asterisks indicate the parameter values from (a).

