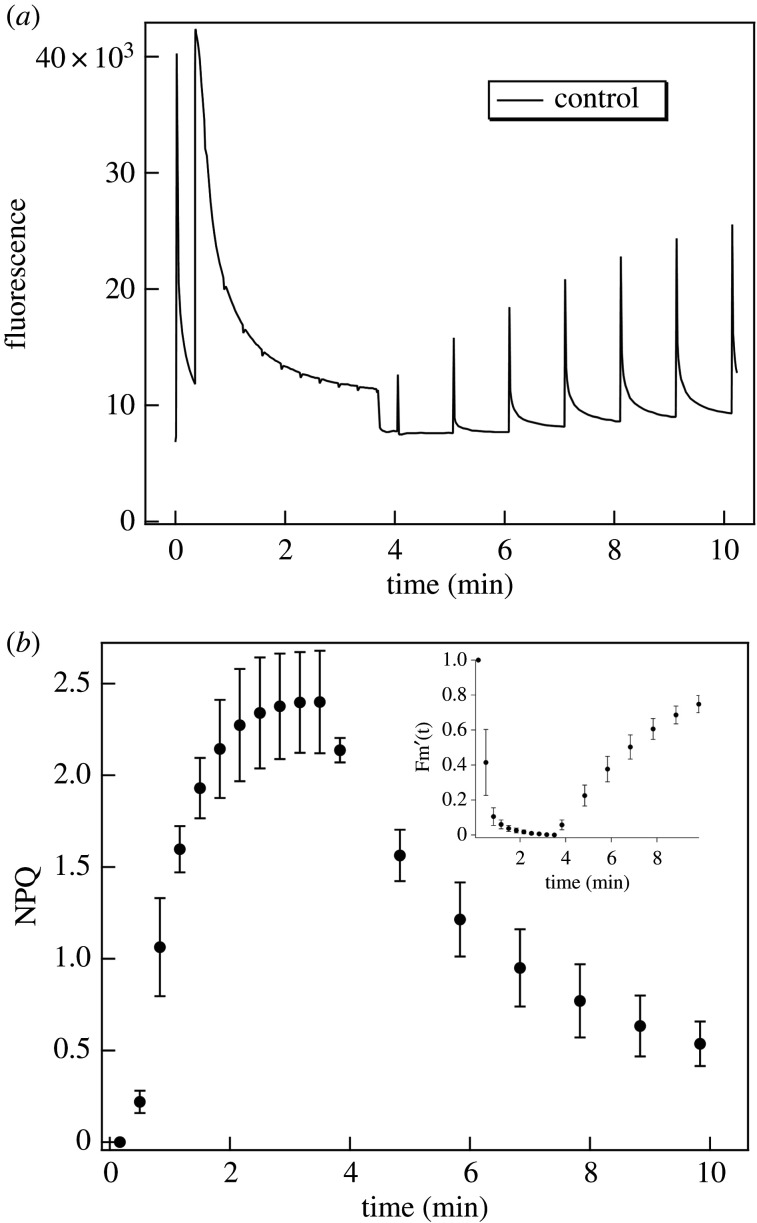
Figure 3.
(a) Typical fluorescence kinetic trace and (b) averaged calculated NPQ kinetics of untreated M. deliciosa leaf segments. Inset: averaged calculated Fm'(t) versus time. The photon flux density of the actinic white light was 1000 µmol photons m−2 s−1; data points in (b), calculated mean values ± s.d., n = 3; (for further details, see text).

