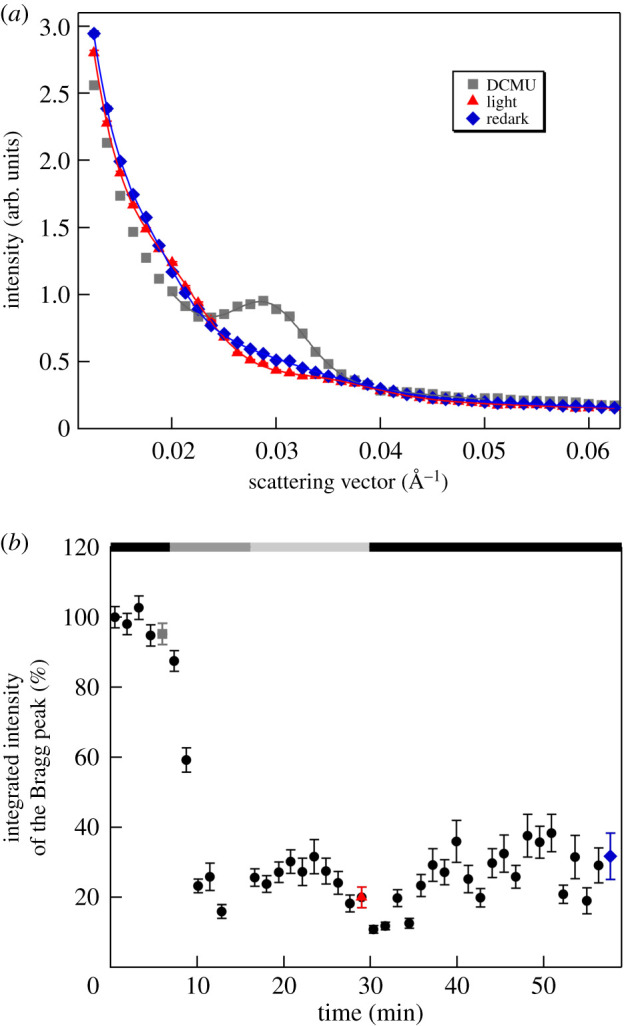
Figure 5.

(a) SANS profiles of a D2O-infiltrated DCMU-treated M. deliciosa leaf segment in the dark, after their illumination and in redark; the samples were dark-adapted for 5 min, illuminated with white light of 300 µmol photons m−2 s−1 and 800 µmol photons m−2 s−1 and in the dark after the illumination period; the lines represent the fitted curves. (b) Integrated intensity of the Bragg peak versus time; the black, dark grey and light grey bars indicate dark conditions, 300 µmol photons m−2 s−1 and 800 µmol photons m−2 s−1 illuminations, respectively; grey, red and blue dots indicate the time of the measured curves. (Measured on KWS2.)
