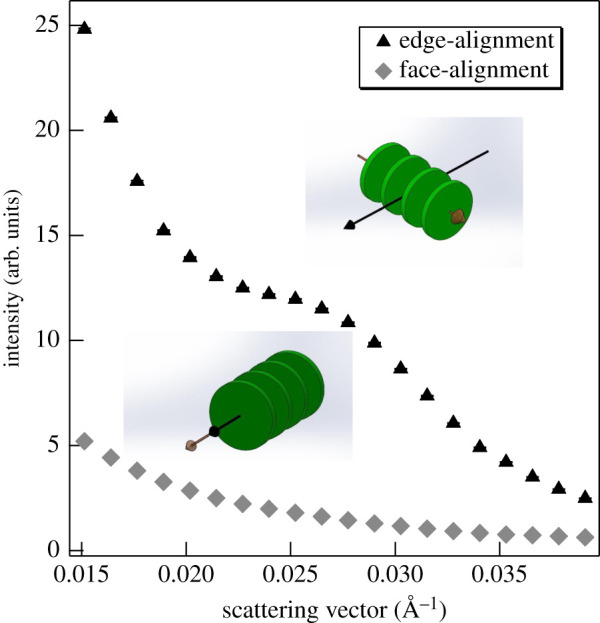
Figure 6.

SANS profiles of isolated pea thylakoid membranes in face- and edge-aligned orientations, as indicated. The membranes are represented by flat green discs; black full arrowhead, direction of the neutron beam; brown empty arrowhead, magnetic vector. (Measured on KWS2, integration times, 2.5 (edge-aligned) and 5 min (face-aligned).)
