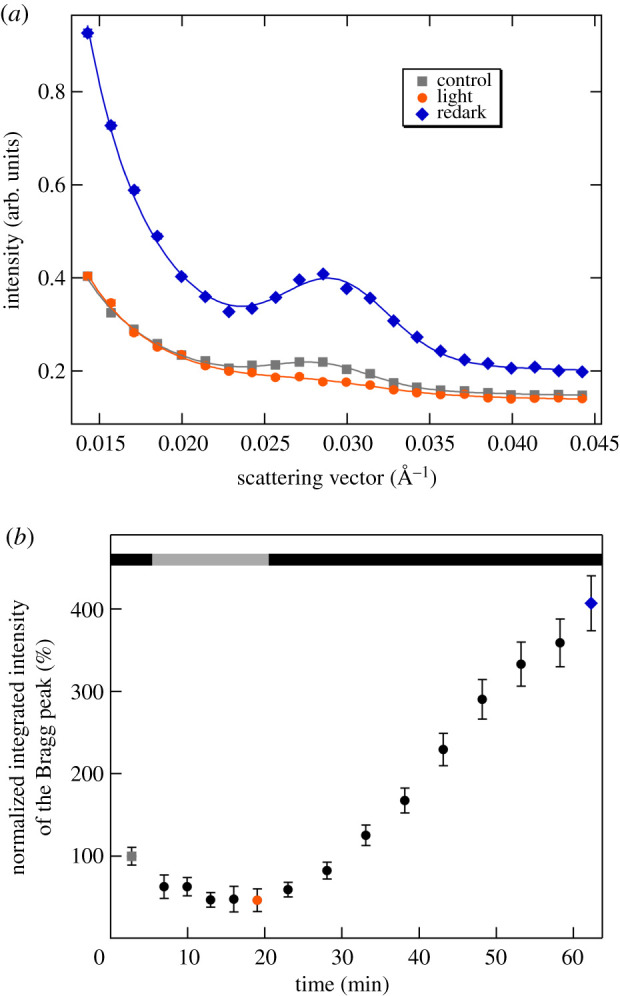
Figure 8.

Effect of a dark-light-redark cycle on the SANS profile of a D2O-infiltrated M. deliciosa leaf segment. (a) Radially averaged SANS curves in the dark, following the illumination of the leaf section with white light of 400 µmol photons m−2 s−1 for 15 min and then kept in dark for 40 min; the lines represent the fitted curves. (b) Variations in the integrated intensity of the Bragg peak during the illumination and redark periods; black and grey bars indicate the dark and the illumination periods, respectively; grey, orange and blue dots refer to the measured curves of the same colour-codes. (Measured on D11.)
