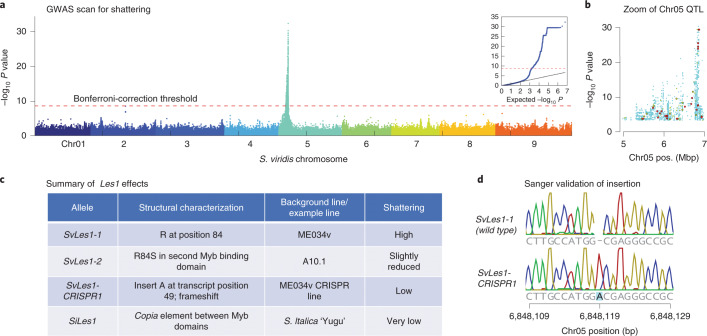
Fig. 3. GWAS and cloning of Les1.
a, Manhattan plot of GWAS results, showing a single QTL (peak −log10 P > 30) for seed shattering on chromosome 5. The red line indicates experiment-wise P = 0.01 level after Bonferroni correction. The GWAS used a univariate mixed linear model from GEMMA40, with centered kinship matrix. Wald test P value was used for assessing significant peaks, but other P value estimates give similar results. b, Zoom-in on the chromosome 5 peak. Larger dots represent missense SNPs identified by snpEff. Different colors of missense SNPs indicate PROVEAN score range (blue for ≥2.5, green for ≤2.5 and ≥4.1, red for ≤4.1; −2.5 and −4.1 represent 80% and 90% specificity). Lower scores indicate higher likelihood of deleterious effects of the mutation. c, Table of Les1 alleles in S. viridis (Sv) and S. italica (Si), with structural characteristics, background line and shattering phenotype. d, Sanger sequence validating the position of the adenine insertion (frameshift) in SvLes1-CRISPR1.

