
Figure 5. Patterned cellular orientation in tubular tissues is maintained after 7 days in culture.
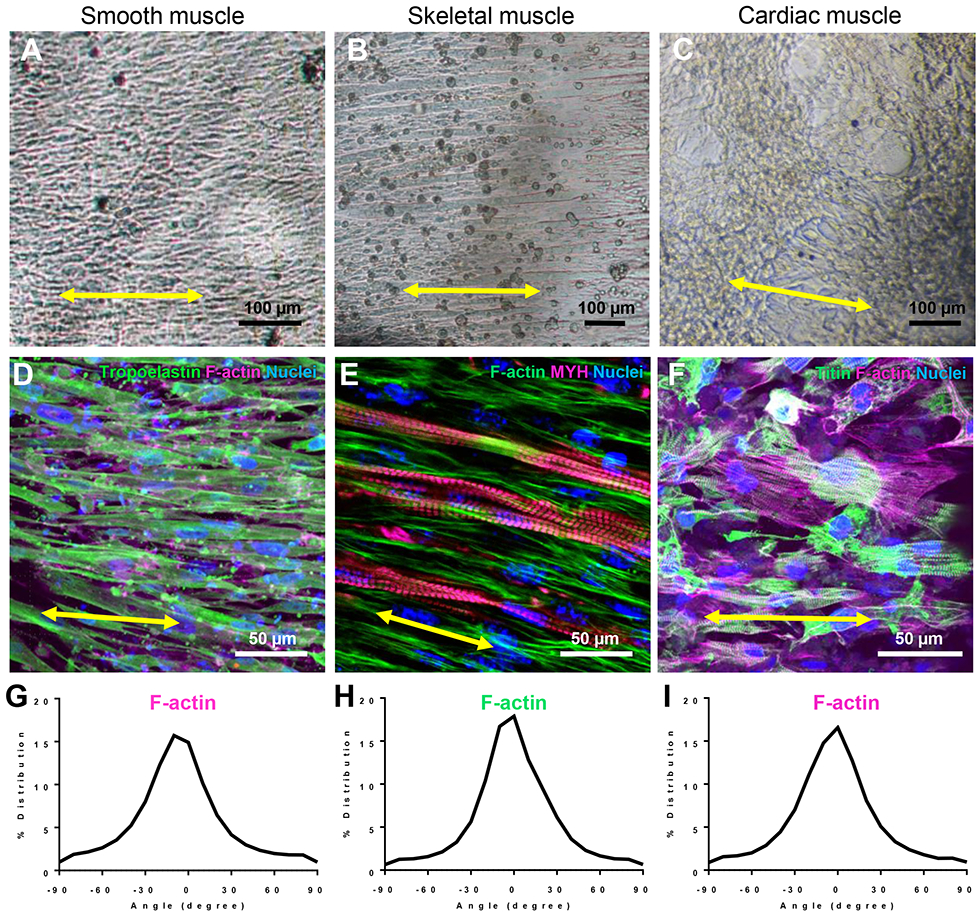
A-C. Brightfield images of SMC (A), skeletal (B), and cardiac (C) tubes after 7,14, or 7 days in culture, respectively.
D-F. Confocal images of each tubular tissues imaged in A-C, respectively. Each tissue was immunostained for cytoskeletal and or contractile proteins as listed and color-coded in the upper right corner of each panel.
G-I. Quantitative analysis of filamentous-actin (F-actin) cytoskeletal alignment of cells in each tissue type.