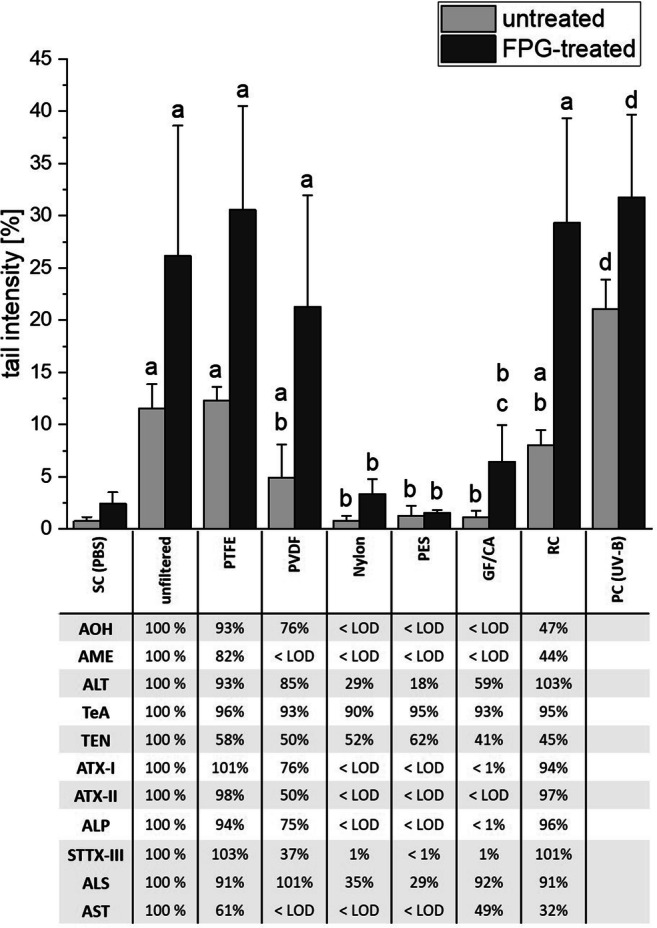
Fig. 3.

Impact of filtration on the genotoxicity of the Alternaria extract in HT-29 cells, as measured by comet assay. Bars are depicting mean values + SD of the measured tail intensities of at least 4 independent biological replicates. Normal distribution was confirmed with the Shapiro-Wilk test. Significant differences were calculated by one-way ANOVA, followed by Fisher LSD post hoc testing (p < 0.05), with “a” indicating a significant difference to the respective solvent control (SC) and “b” to the unfiltered extract. A separate one-way ANOVA was carried out for the samples revealing very low tail intensities to again test for significant differences to the respective solvent control, which are indicated by “c.” The positive control was tested against the SC with Student’s t test, observed significant differences therewith are indicated by “d.” The same was used for testing the impact of FPG treatment for each sample, which significantly enhanced tail intensities of all samples, including SC, except for the PES filtrate (not indicated). The underlying table shows LC-MS data for the corresponding aqueous filtrates, in relation to the respective toxin concentration in the unfiltered sample
