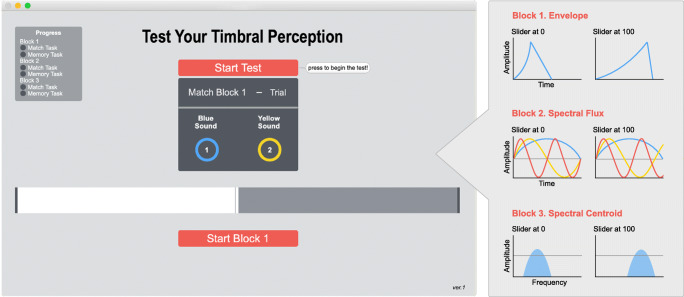
Fig. 1.
The layout of the TPT (left) and its testing dimensions (right). Graphic figures for the testing dimensions show how the reproduction tone is manipulated when the slider is positioned at ‘0’ (far left) or positioned at ‘100’ (far right). Envelope represents rise and fall time in amplitude, Spectral Flux represents the alignment of harmonics that results as more consonant when aligned in-phase, Spectral Centroid represents the filtered frequency area in the frequency spectrum. (Colour figure online)

