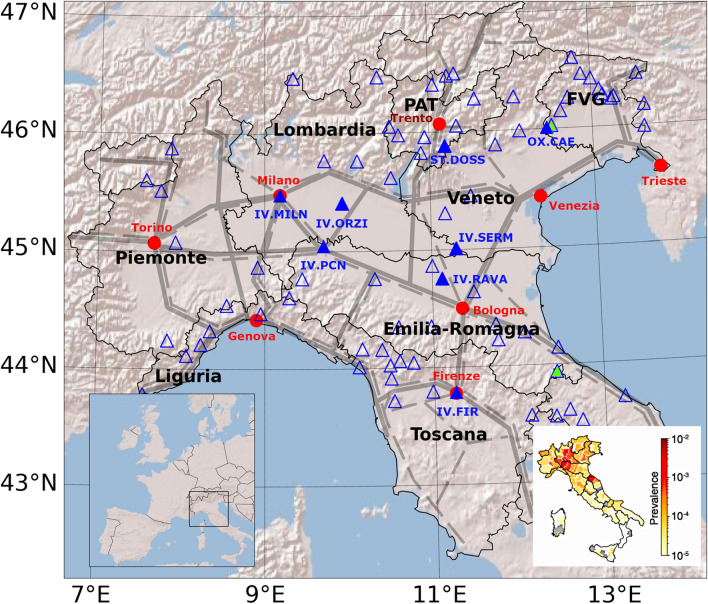
Figure 1.
Map of the Italian regions targeted by this work. Thin black lines are regional borders. The bottom left panel shows where these regions are located in Western Europe. Blue-filled triangles mark the location of the stations discussed in the “Results” section. Empty triangles mark the location of all the seismic stations considered in this work. Green filled triangles mark those sites excluded from the socio-economic analysis. Red-filled circles mark the location of regional capital cities. PAT and FVG stand for Provincia Autonoma di Trento and Friuli-Venezia Giulia, respectively. Gray lines marks highways (solid) and railways (dashed). Figure created using Matplotlib Basemap Toolkit41. Bottom right frame: COVID-19 spatial spread as confirmed case/population in Italy for March 10, 2020. Figure modified after Gatto et al.(18: figure 1, used under CC BY 4.0 https://creativecommons.org/licenses/by/4.0/).

