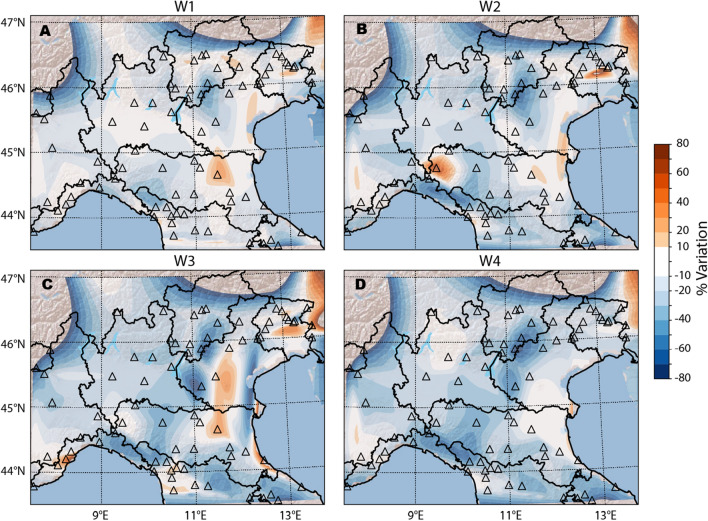
Figure 5.
Spatial interpolation of the percent noise variation (PNV) for the case of W1, W2, W3 and W4. In each panel triangles mark the position of the 78 seismic stations, each colour coded according to its corresponding PNV and to the selected palette shown on the right side of the figure. White colour refers to a percent variation between − 10% and 10% that we consider a null change to encompass the error bars. Figure created using Matplotlib Basemap Toolkit41.

