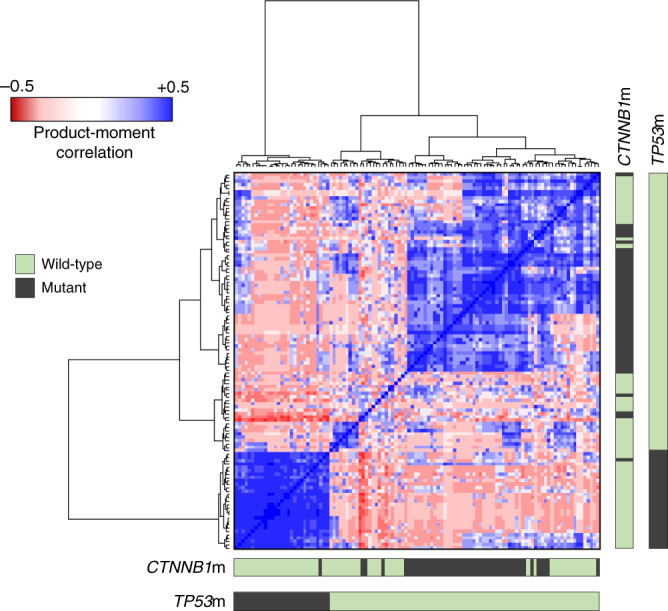
Fig. 2. Unsupervised clustering of endometrioid ovarian carcinomas by patterns of mutation.

Product-moment correlation scores between samples were calculated using binary matrices representing the status of most frequently mutated genes (1 = mutant, 0 = wild-type), yielding a matrix of quantified genomic correlation. These data were subject to hierarchical clustering using Euclidean distance and Ward’s linkage. Bars denote mutation in CTNNB1 and TP53.
